
Helping a Middle East-based academic and policy research institution turn complex international trade sanction data into a real-time analytics platform for faster, more credible economic analysis.
The client is a leading academic institution specializing in economic modeling, international trade analysis, and policy research. Its researchers support governments, NGOs, and industry leaders with insights into market trends, regulatory outcomes, and the economic effects of trade policy decisions.
As the institution’s research scope expanded, traditional analysis methods became harder to scale. Researchers were working with large import and export datasets, commodity flow records, policy response data, and country-level economic indicators, but much of the workflow still depended on static reports and manual Excel-based models.
The challenge was making high-volume economic data easier to process, compare, and communicate.
The research team needed to evaluate the impact of international trade sanctions across multiple nations and economic variables. This required frequent recalibration, manual data preparation, and repeated scenario testing, which slowed down academic reporting and policy analysis.
Static reports were not flexible enough for fast-moving research questions. Analysts needed to compare indicators, test assumptions, filter by region or commodity, and communicate findings clearly to both technical and non-technical stakeholders.
The goal was to build an interactive economic impact dashboard that could process large datasets efficiently, visualize sanction-related patterns in real time, and fit naturally into the institution’s existing research workflows.
We built a scalable analytics framework for trade sanction analysis.
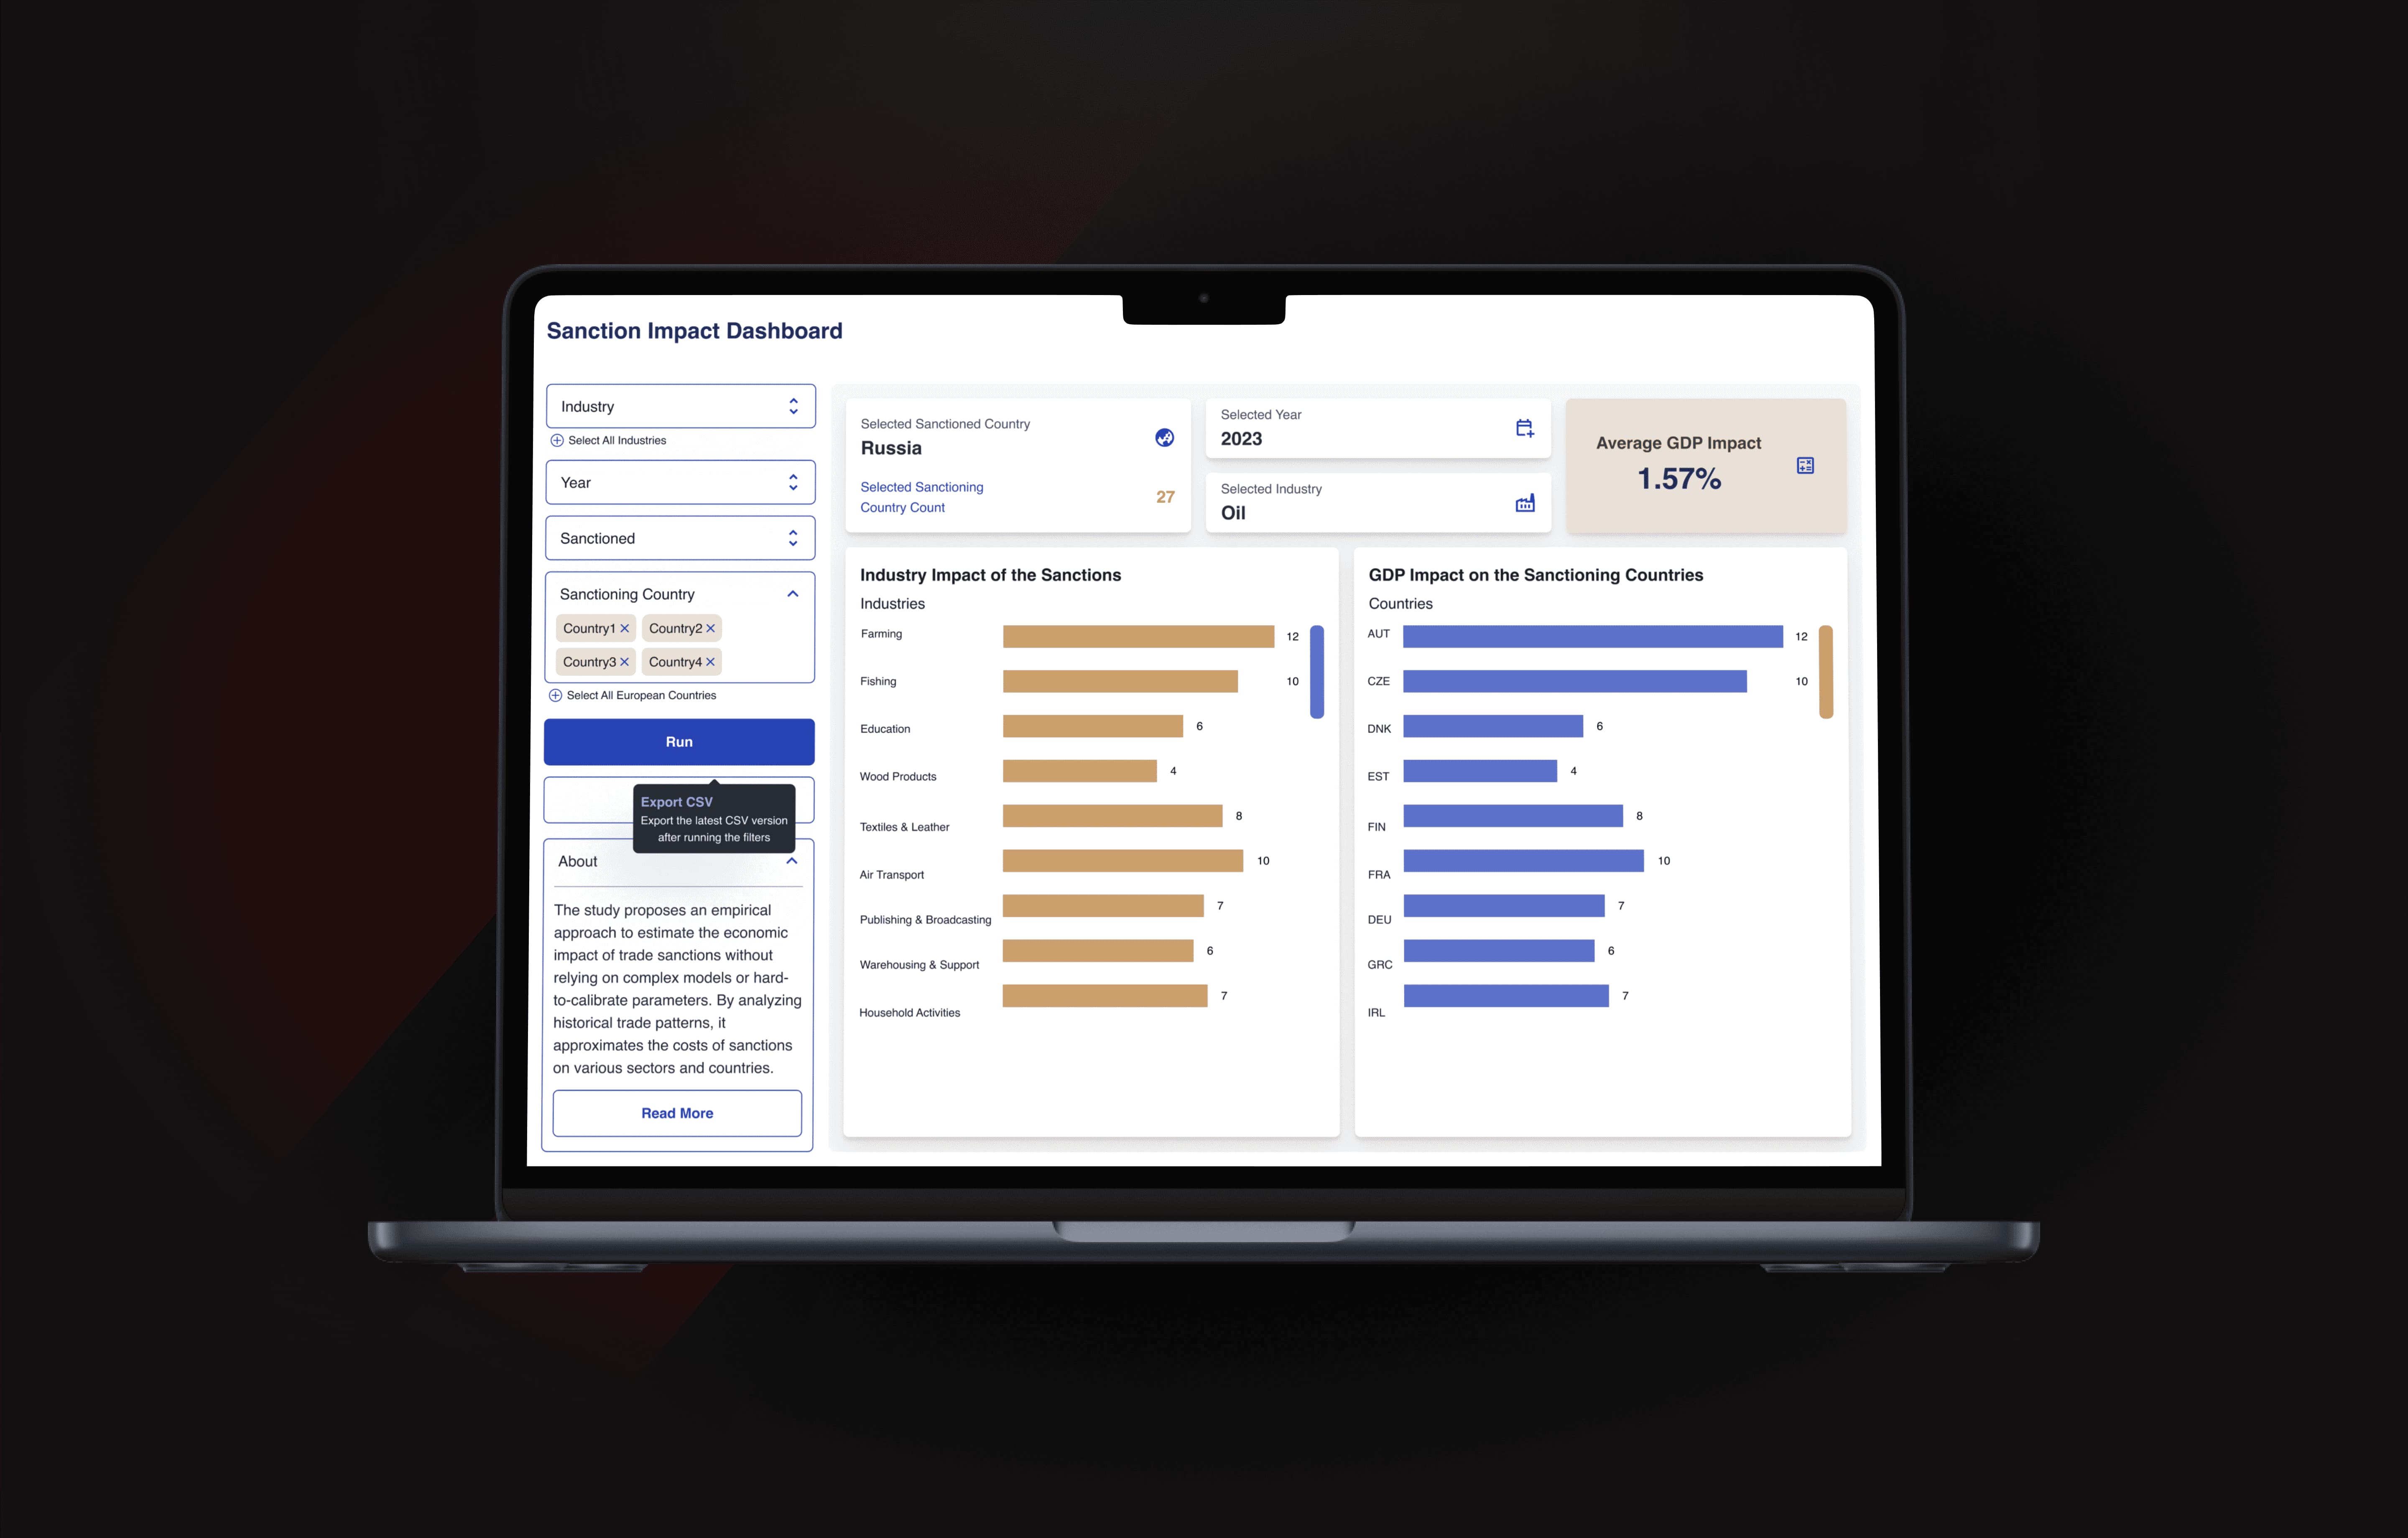
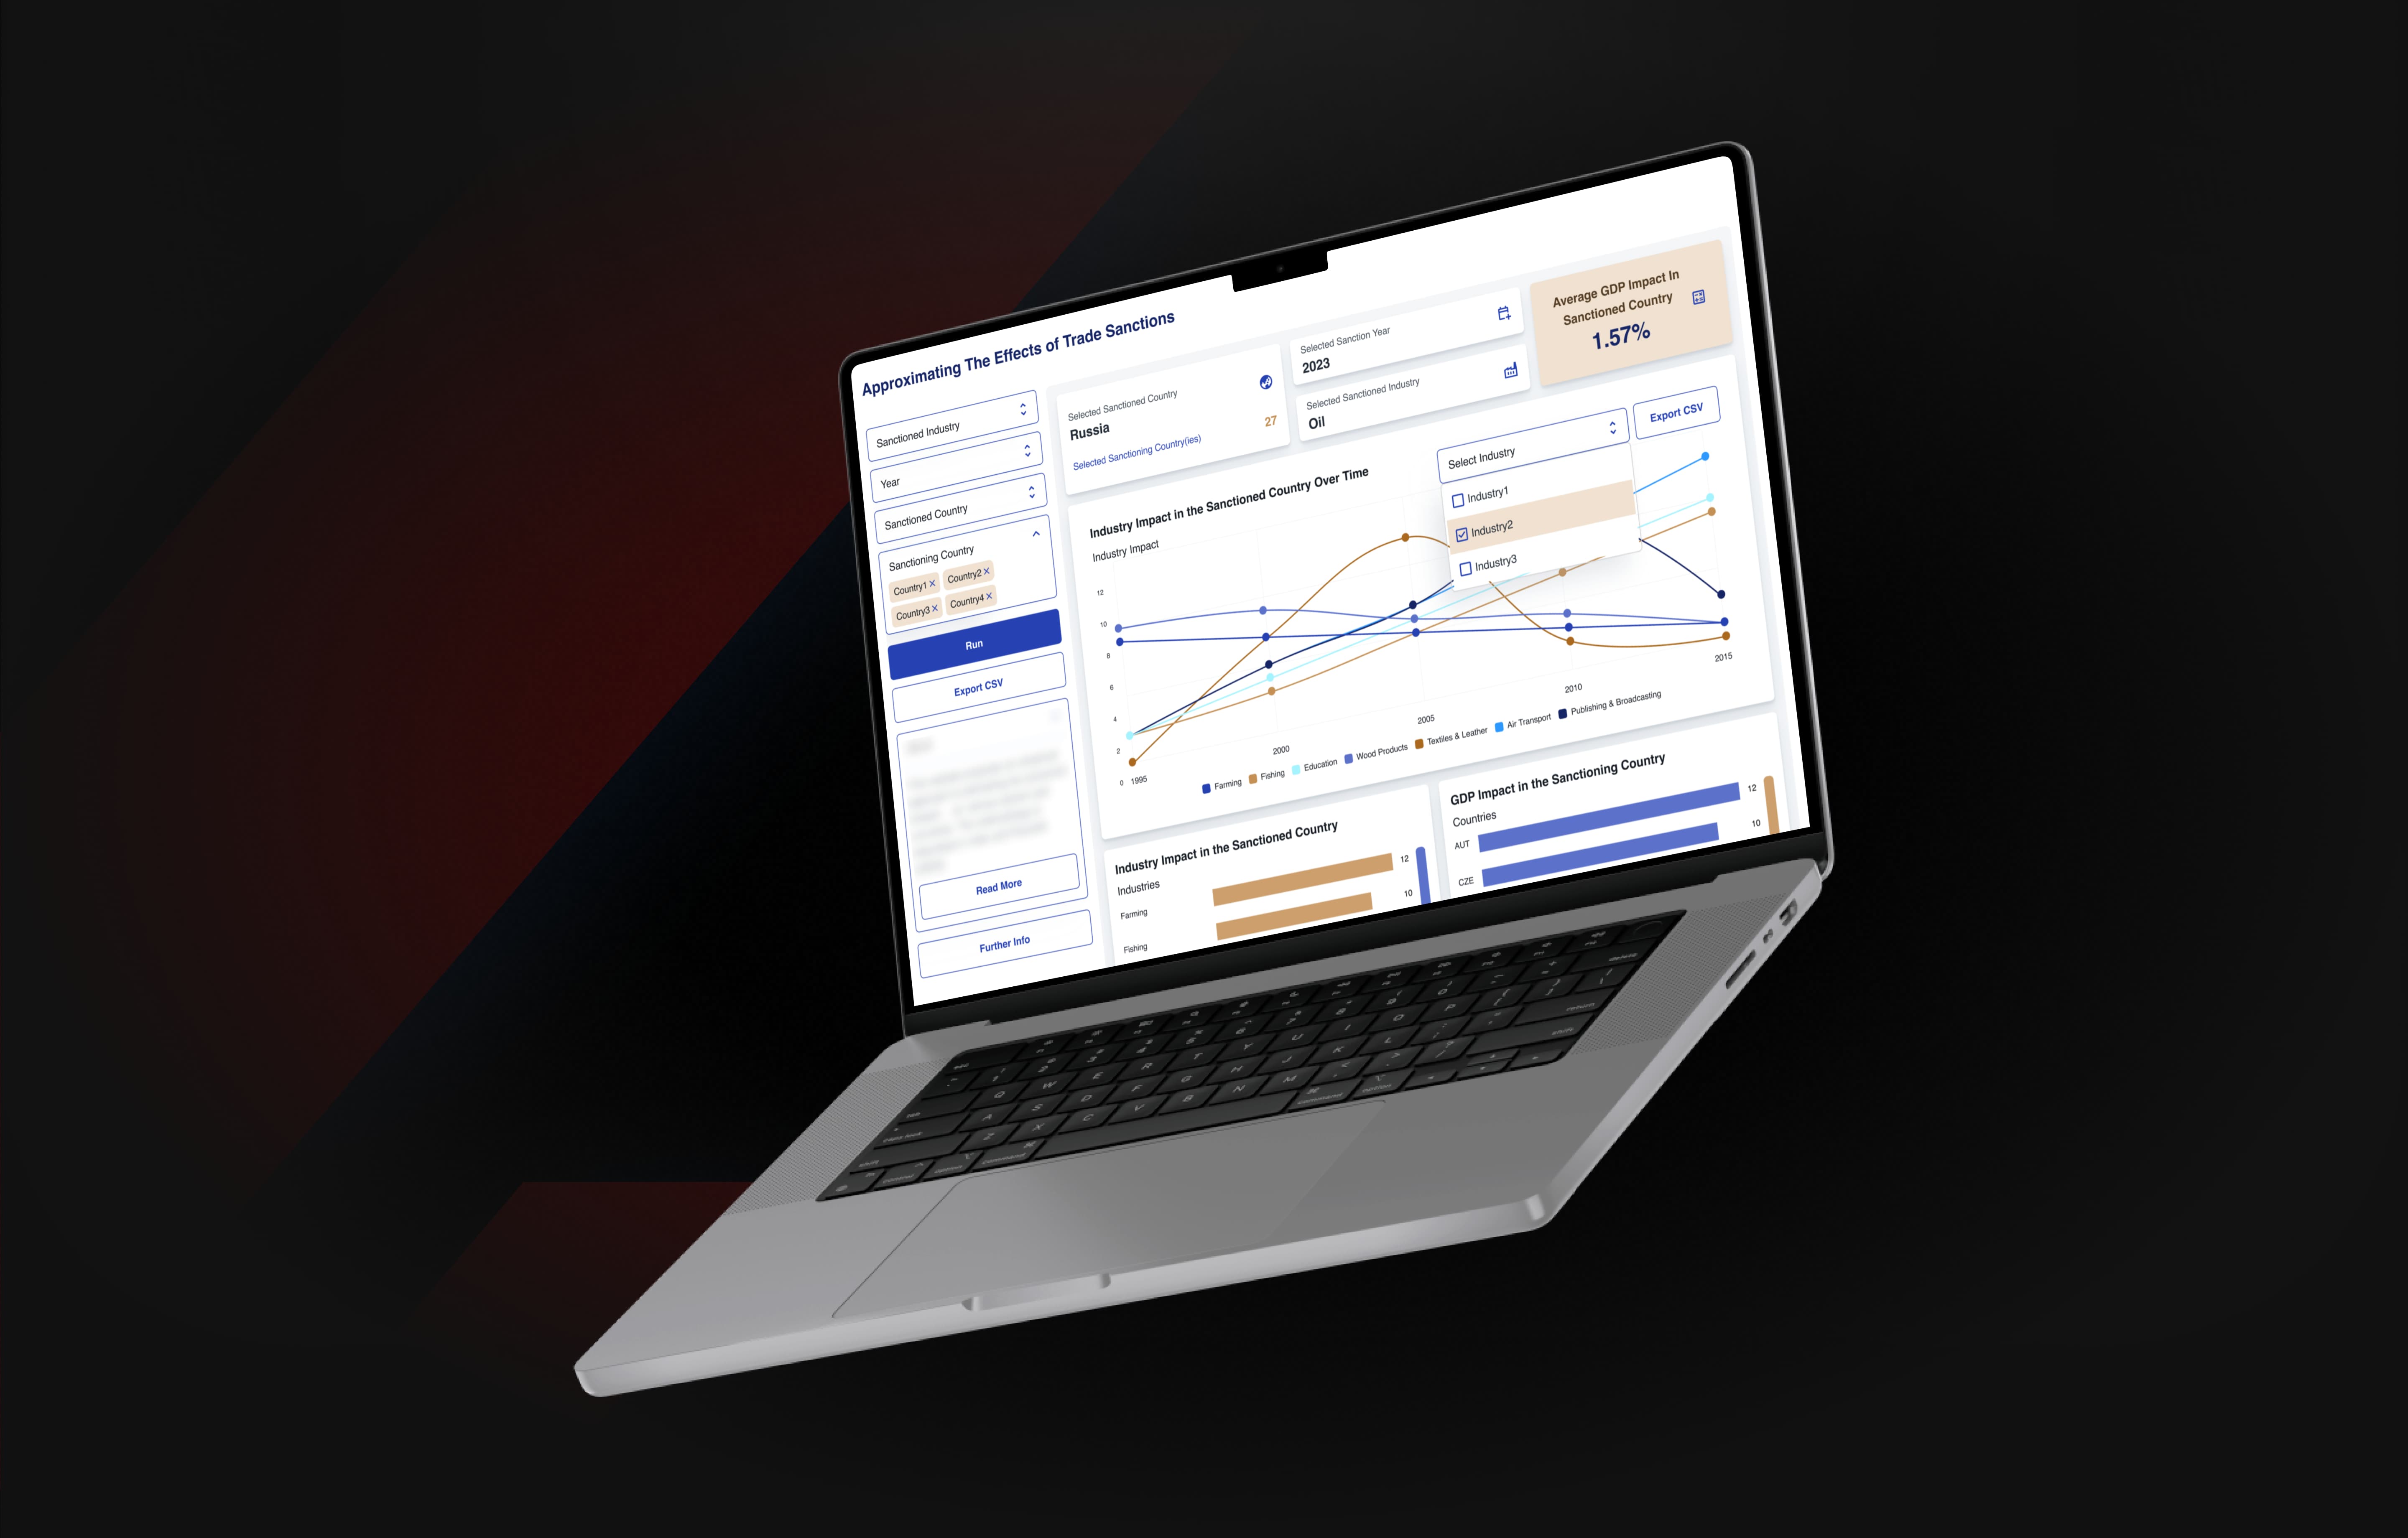
The solution started with an advanced big data analytics pipeline designed to process high-volume international trade datasets. The system integrated filtering, correlation logic, and structured data models to help researchers identify sanction-related trends across imports, exports, commodity flows, and policy responses.
This created a stronger analytical foundation for testing economic scenarios and understanding how sanctions affected different markets, regions, and trade categories.
The dashboard translated complex economic models into interactive research views.
The platform was developed with Plotly Dash, enabling dynamic charts, interactive filters, comparative analysis views, and live data refreshes. Researchers could move between macro-level economic patterns and more specific country, commodity, or policy-level details without rebuilding reports manually.
The interface was designed in Figma with a focus on clarity, speed, and research usability. Contextual tooltips, clean visual hierarchy, and minimalist layouts helped make complex economic relationships easier to interpret and communicate.
The system was deployed on AWS with Docker for reliability and scale.
To support long-term research use, the platform was deployed through AWS cloud infrastructure using Dockerized containers. This made the system easier to maintain, scale, and extend for future datasets, research questions, and institutional users.
The cloud-based architecture also helped ensure consistent performance and availability, turning the dashboard into a sustainable research asset rather than a one-time reporting tool.
Built a scalable analytics pipeline for international trade and sanction datasets
Developed an interactive Plotly Dash dashboard for real-time economic analysis
Designed researcher-friendly interfaces with Figma
Deployed the platform on AWS with Dockerized infrastructure
Improved research efficiency by 45%
Accelerated policy evaluation cycles by 3×
Achieved 99.8% system uptime
The result was a faster and more actionable economic research workflow.
The final platform helped the institution move from static reporting and manual models to an interactive analytics environment. Researchers could process data faster, compare economic scenarios more easily, and generate credible insights within hours instead of days.
By combining scalable data processing, real-time visualization, and cloud infrastructure, the dashboard improved how economic impact analysis was explored, communicated, and used in policy-oriented research.
The value of the dashboard was not only in visualizing trade sanction data, but in helping researchers turn complex economic signals into clearer policy insight faster.
More works.

" height="56.88889185587561px" id="STzxULXmg" transform="translate(3.556 3.556)" width="56.8888918558755px"/></g></svg>)
Operational Efficiency Enhancement
Operational Efficiency Enhancement Dashboard
Helping a US-based, youth development nonprofit organization, streamline reporting and enhance operational efficiency with real-time dashboards that automate workflows and improve decision-making.

Interactive Sales Intelligence
Interactive Sales Intelligence Dashboard
Transforming a US-Based, Global Premium Spirits Company’s sales operations with precision targeting and mobile-first insights. By combining internal data with real-world restaurant insight.

AI-Driven Financial Insights Platform for SMEs
AI-Driven Financial Insights Platform for SMEs
A multilingual, AI-powered financial intelligence platform that centralizes data, enables instant insights, and empowers Southeast Asian SMEs to make confident, data-driven decisions.