
Orhan Gazi Yalçın
11 Min Read
Knowing about the differences and similarities between Power BI, Looker Studio (aka Google Data Studio), and Tableau might be more important than you think!
Introduction
Power BI, Tableau, and Looker Studio are three of the market's most widely used business intelligence (BI) technologies. Each of these technologies offers unique features and capabilities, making them suitable for different types of businesses.
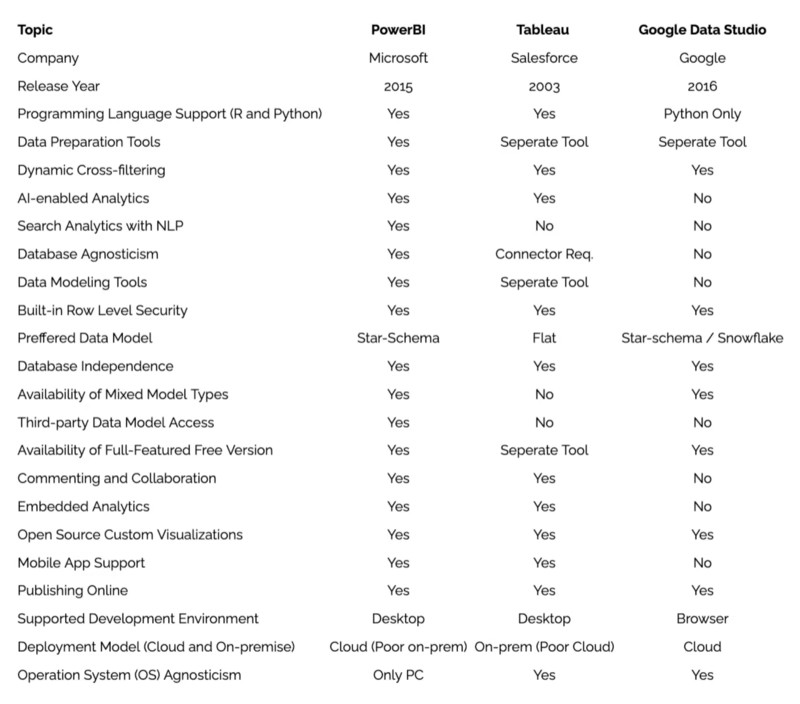
All these BI tools have been developed and maintained by big tech companies and released in different years. Power BI is a business intelligence tool developed by Microsoft and was first released in 2015. Tableau, developed by Salesforce, was first released in 2003. LookerStudio (aka Google Data Studio), developed by Google, was first released in 2016. For an even sharper, side-by-side breakdown of Power BI and Tableau, skim our BI tools deep dive before you choose a winner.
Understanding the similarities and differences between these technologies is crucial for businesses to decide which tool best aligns with their requirements.
This blog post aims to explain 21 criteria related to the features and capabilities of Power BI, Tableau, and Looker Studio (Google Data Studio).
These criteria will be shown under 4 categories in detail:
Data processing and manipulation
Database compatibility and independence
Collaboration and accessibility
System compatibility
The categories are beneficial for providing a comprehensive overview of the unique features and capabilities of Power BI, Tableau, and Looker Studio. The primary motivation of this blog is to help businesses make a more informed choice when it comes to selecting the right BI technology for their specific needs. That decision becomes even sharper when you understand the types of big data analytics driving each tool’s most advanced use-cases.
Let’s dive right in!
Data Processing and Manipulation

There are five distinct criteria we can scrutinize under data processing and manipulation:
Programming Language Support (R and Python)
Data Preparation Tools
Dynamic Cross-filtering
AI-enabled Analytics
Search Analytics with NLP
While we may observe common design choices for some of these criteria, BI Tools can diverge from one another for the other criteria.
Programming Language Support (R and Python)
Power BI, Tableau, and Looker Studio all support R and Python differently. Power BI and Tableau provide full support for R and Python, making them suitable for businesses that require advanced analytics capabilities and have a team of data scientists or developers proficient in R or Python. Looker Studio, on the other hand, provides only Python support, which makes it suitable for businesses that require basic analytics capabilities and don’t have developers proficient in R or Python. The choice of tool depends on the nature of the project and the level of analytical capabilities required for the business to make informed decisions.
Data Preparation Tools
Data preparation tools are essential to the data analytics process, allowing users to ensure that data is accurate, complete, and in the appropriate format for analysis. Power BI, Tableau, and Looker Studio all provide data preparation tools that allow users to clean, transform, and manipulate data before using it for analysis. The level of functionality and support may vary across the platforms, but these tools can save time and improve the quality of insights by providing data discovery and exploration features, data integration, transformation capabilities, and more. If forecasting accuracy tops your shortlist, our predictive analytics guide shows how each BI suite plugs into time-series pipelines.
Dynamic Cross-filtering
All three tools, Power BI, Tableau, and Looker Studio, provide dynamic cross-filtering capabilities. Power BI and Tableau have a more robust set of functionalities in terms of cross-filtering. Power BI has filter cards and slicers, and Tableau has drag-and-drop functionality. Looker Studio is more focused on ease of use with its filter selection on the visualization. The type of dynamic cross-filtering to choose depends on the nature of the business, the complexity of the data, and the user’s preferences on how they prefer to analyze data.
AI-enabled Analytics
Power BI, Tableau, and Looker Studio all provide some form of AI-enabled analytics. Power BI and Tableau provide a more advanced set of functionalities in AI-enabled analytics, while Looker Studio focuses on providing pre-built models and integration with Google’s AI platform. The choice of tool depends on the nature of the business, the complexity of the data, the level of analytical capabilities required, and the knowledge and expertise of the team in R or Python.
Development Environment
Power BI, Tableau, and Looker Studio follow different development approaches. Power BI and Tableau provide a desktop environment that gives access to more advanced analytics and modeling capabilities, while Looker Studio offers a browser-based environment that prioritizes collaboration and real-time sharing of data visualizations. Businesses should evaluate their specific needs before choosing a tool that best aligns with their requirements and provide the required analytics and visualization capabilities.
Search Analytics with NLP
Power BI provides a robust set of functionalities in search analytics with NLP through its integration with Azure Cognitive Search; Tableau can use TabPy integration to connect to Python NLP libraries, while Google Data Studio currently does not provide this feature. The choice of tool depends on the business’s nature, the data’s complexity, the level of analytical capabilities required, and the type of unstructured data the business is looking to extract insights.
Database Compatibility and Independence

Under this category, six criteria uniquely identify the BI Tool’s capabilities:
Database Agnosticism
Data Modeling Tools
Built-in Row Level Security
Preferred Data Model
Database Independence
Availability of Mixed Model Types
Third-party Data Model Access
Database compatibility and independence for BI tools refer to a business intelligence platform's ability to work seamlessly with various data sources without requiring additional software or modifications to the underlying databases.
Database Agnosticism
Power BI, Tableau, and Looker Studio all provide database-agnostic capabilities, meaning they can connect to and work with multiple databases without requiring any specific database management system. Power BI is an ideal tool for businesses with diverse data sources and real-time streaming data, and Tableau is ideal for companies with large amounts of data. At the same time, Looker Studio is well-suited for businesses that use Google’s cloud services and want to visualize their data in Looker Studio.
Data Modeling Tools
Power BI, Tableau, and Looker Studio all provide data modeling tools with different capabilities and functionalities. Power BI provides an intuitive and easy-to-use data modeling feature suitable for business users with the little technical background. Tableau’s data modeling feature is more advanced and requires a greater level of technical knowledge, while Looker Studio allows data modeling on the source and its flexibility on the model it uses, either star or snowflake. The choice of tool depends on the nature of the business, the complexity of the data, the level of technical knowledge of the users, and the type of data model the company needs to create.
Built-in Row Level Security
Power BI, Tableau, and Looker Studio all provide built-in row-level security capabilities, which allow users to set up and manage access controls at the individual data record level. This feature enables data owners to restrict access to sensitive information based on user roles and permissions, which is essential in maintaining confidentiality and integrity.
Preferred Data Model
Power BI, Tableau, and Looker Studio all support both star and snowflake schema, but they may have different defaults and optimization for one or the other. Power BI has a default data model of the star schema. Tableau allows the user to choose the data model, and Looker Studio adapts to the data source; this allows the user to choose the best-suited data model for their data and analysis requirements.
Database Independence
Power BI, Tableau, and Looker Studio all provide database independence, meaning they can connect to and work with multiple databases without requiring any specific database management system or vendor-specific software. Power BI is an ideal tool for businesses with diverse data sources and real-time streaming data, and Tableau is ideal for companies with large amounts of data. At the same time, LookerStudio is well-suited for businesses that use Google’s cloud services and want to visualize their data in Looker Studio.
Availability of Mixed Model Types
Power BI, Tableau, and Looker Studio support mixed model types but with different capabilities and functionalities. Power BI allows users to combine different types of data models within the same project or dataset, making it easy for business users to create and maintain mixed data models. Tableau allows users to create and combine different types of data models within the same project or dataset, but it does not enforce any specific data model. Looker Studio allows users to model data in either a star schema or a snowflake schema, but it does not support mixing data models within the same dataset. The choice of tool depends on the nature of the business, the complexity of the data, the level of technical knowledge of the users, and the type of data model the company needs to create.
Third-party Data Model Access
Power BI, Tableau, and Looker Studio provide third-party data model access, enabling businesses to leverage pre-built data models or data structures from third-party vendors to improve data analysis and visualization capabilities. Power BI, Tableau, and Looker Studio provide a wide range of data connectors built and maintained by the official and the community; this allows users to connect to a wide range of data sources, including those created by third-party vendors or external sources.
Collaboration and Accessibility

Under the category, six criteria reflect the BI Tools’ interaction and multi-user capabilities:
Availability of Full-Featured Free Version
Commenting and Collaboration
Embedded Analytics
Open Source Custom Visualizations
Mobile App Support
Publishing Online
Collaboration and accessibility for BI tools refer to the ability of a business intelligence platform to allow multiple users to access and interact with the data and insights in a seamless and efficient manner.
Commenting and Collaboration
Commenting and collaboration features are essential for businesses that rely on data-driven decision-making. These features enable teams to collaborate on data projects, share insights, and make data-driven decisions faster. Power BI, Tableau, and Looker Studio all provide powerful commenting, and collaboration features that can help organizations work more efficiently and better use their data.
Embedded Analytics
Embedded analytics is a powerful feature that allows organizations to provide data-driven insights to users within the application context they are already using. This can help businesses improve operational efficiency, provide more value to customers, and make better use of data. Power BI, Tableau, and Looker Studio all provide embedded analytics features that can help organizations implement embedded analytics in their own applications.
Open Source Custom Visualization
The open-source custom visualization feature is a powerful tool for businesses that need to create custom visualizations tailored to their specific needs. Power BI, Tableau, and Looker Studio all provide open-source custom visualization options to some degree, but the level of support and functionality varies across the platforms. Developers can use pre-existing code and tools to create unique visualizations, giving them more freedom and flexibility in their data visualization.
Mobile Apps
Mobile apps are essential for businesses that rely on data-driven decision-making and have mobile workforces. Mobile apps allow users to access and interact with data visualizations, reports, and dashboards on the go, which can help them make better decisions when working remotely. Power BI, Tableau, and Looker Studio all provide mobile apps that allow users to access and interact with their data on the go to take advantage of data insights even in the field.
Publishing Online
The ability to share data visualizations, reports, and dashboards with anyone on the internet is a powerful feature that allows organizations to share data-driven insights with customers, partners, or the public at large, without the need for them to have a login or an account. This feature can make data more accessible, and it can also open new business opportunities. Power BI, Tableau, and Looker Studio all provide the ability to share data visualizations, reports, and dashboards with anyone on the internet. Still, the level of functionality and options may vary across the platforms.
System Compatibility

Under the category, three criteria represent the BI Tools’ capabilities in working with various environments.
Supported Development Environment
Deployment Model (Cloud and On-premise)
Operation System (OS) Agnosticism
System compatibility for BI tools refers to the ability of a business intelligence platform to work seamlessly with a variety of different types of systems and environments.
Supported Development Environment
Power BI, Tableau, and Looker Studio all provide supported development environments that allow developers to create custom visualizations and scripts, connect and analyze data, and perform data preparation. This allows developers to leverage the full potential of these tools and create more advanced and customized reports, dashboards, and analyses tailored to their organization's specific needs.
Deployment Model
When choosing data visualization and reporting software, it’s important to consider the deployment model and how it aligns with your business needs and IT infrastructure. The cloud deployment model can be highly convenient as it allows for easy access and scalability, but on-premise options may be necessary for certain industries and regulatory requirements. Looker Studio, Tableau, and Power BI each provide different options. Power BI is primarily cloud-based, with poor on-premise options. Tableau offers on-premise deployment, but its cloud option could be stronger. Looker Studio, on the other hand, is entirely cloud-based.
OS Agnosticism
Regarding operating system support, Tableau stands out as it is fully supported across Windows, Mac, and Linux. Power BI is primarily available on Windows, and Looker Studio is available through the web browser and thus can be accessed from any OS. This OS-agnostic feature allows businesses to use BI tools on any device, regardless of the operating system, and to increase the flexibility and mobility of their data analytics.
Final Remarks

In conclusion, Power BI, Tableau, and Looker Studio are three powerful business intelligence (BI) tools that can help businesses gain valuable insights and make more informed decisions. This blog aimed to explain 21 criteria related to the features and capabilities of these technologies, providing a comprehensive overview of their similarities and differences.
By understanding these tools’ unique features and capabilities, businesses can select the one that best aligns with their requirements, whether a full-featured free version, advanced analytics, modeling capabilities, or ease of use and collaboration.
Additionally, businesses can also evaluate the support for R and Python, the level of AI-enabled analytics and search analytics with NLP, the availability of data preparation and modeling tools, and built-in row-level security, among other things.
Overall, by understanding the features and capabilities of Power BI, Tableau, and Looker Studio, businesses can make a more informed decision when it comes to selecting the right BI tool for their specific needs. These insights can be used to improve the decision-making process, increase efficiency, and drive growth in their departments, companies, and future endeavors.
If you’re interested in learning more about how these tools can benefit your organization, please don’t hesitate to contact us. Our team of experts is ready to assist you and help you make the most of these powerful tools.
If you like this article, you can check out our other articles.


