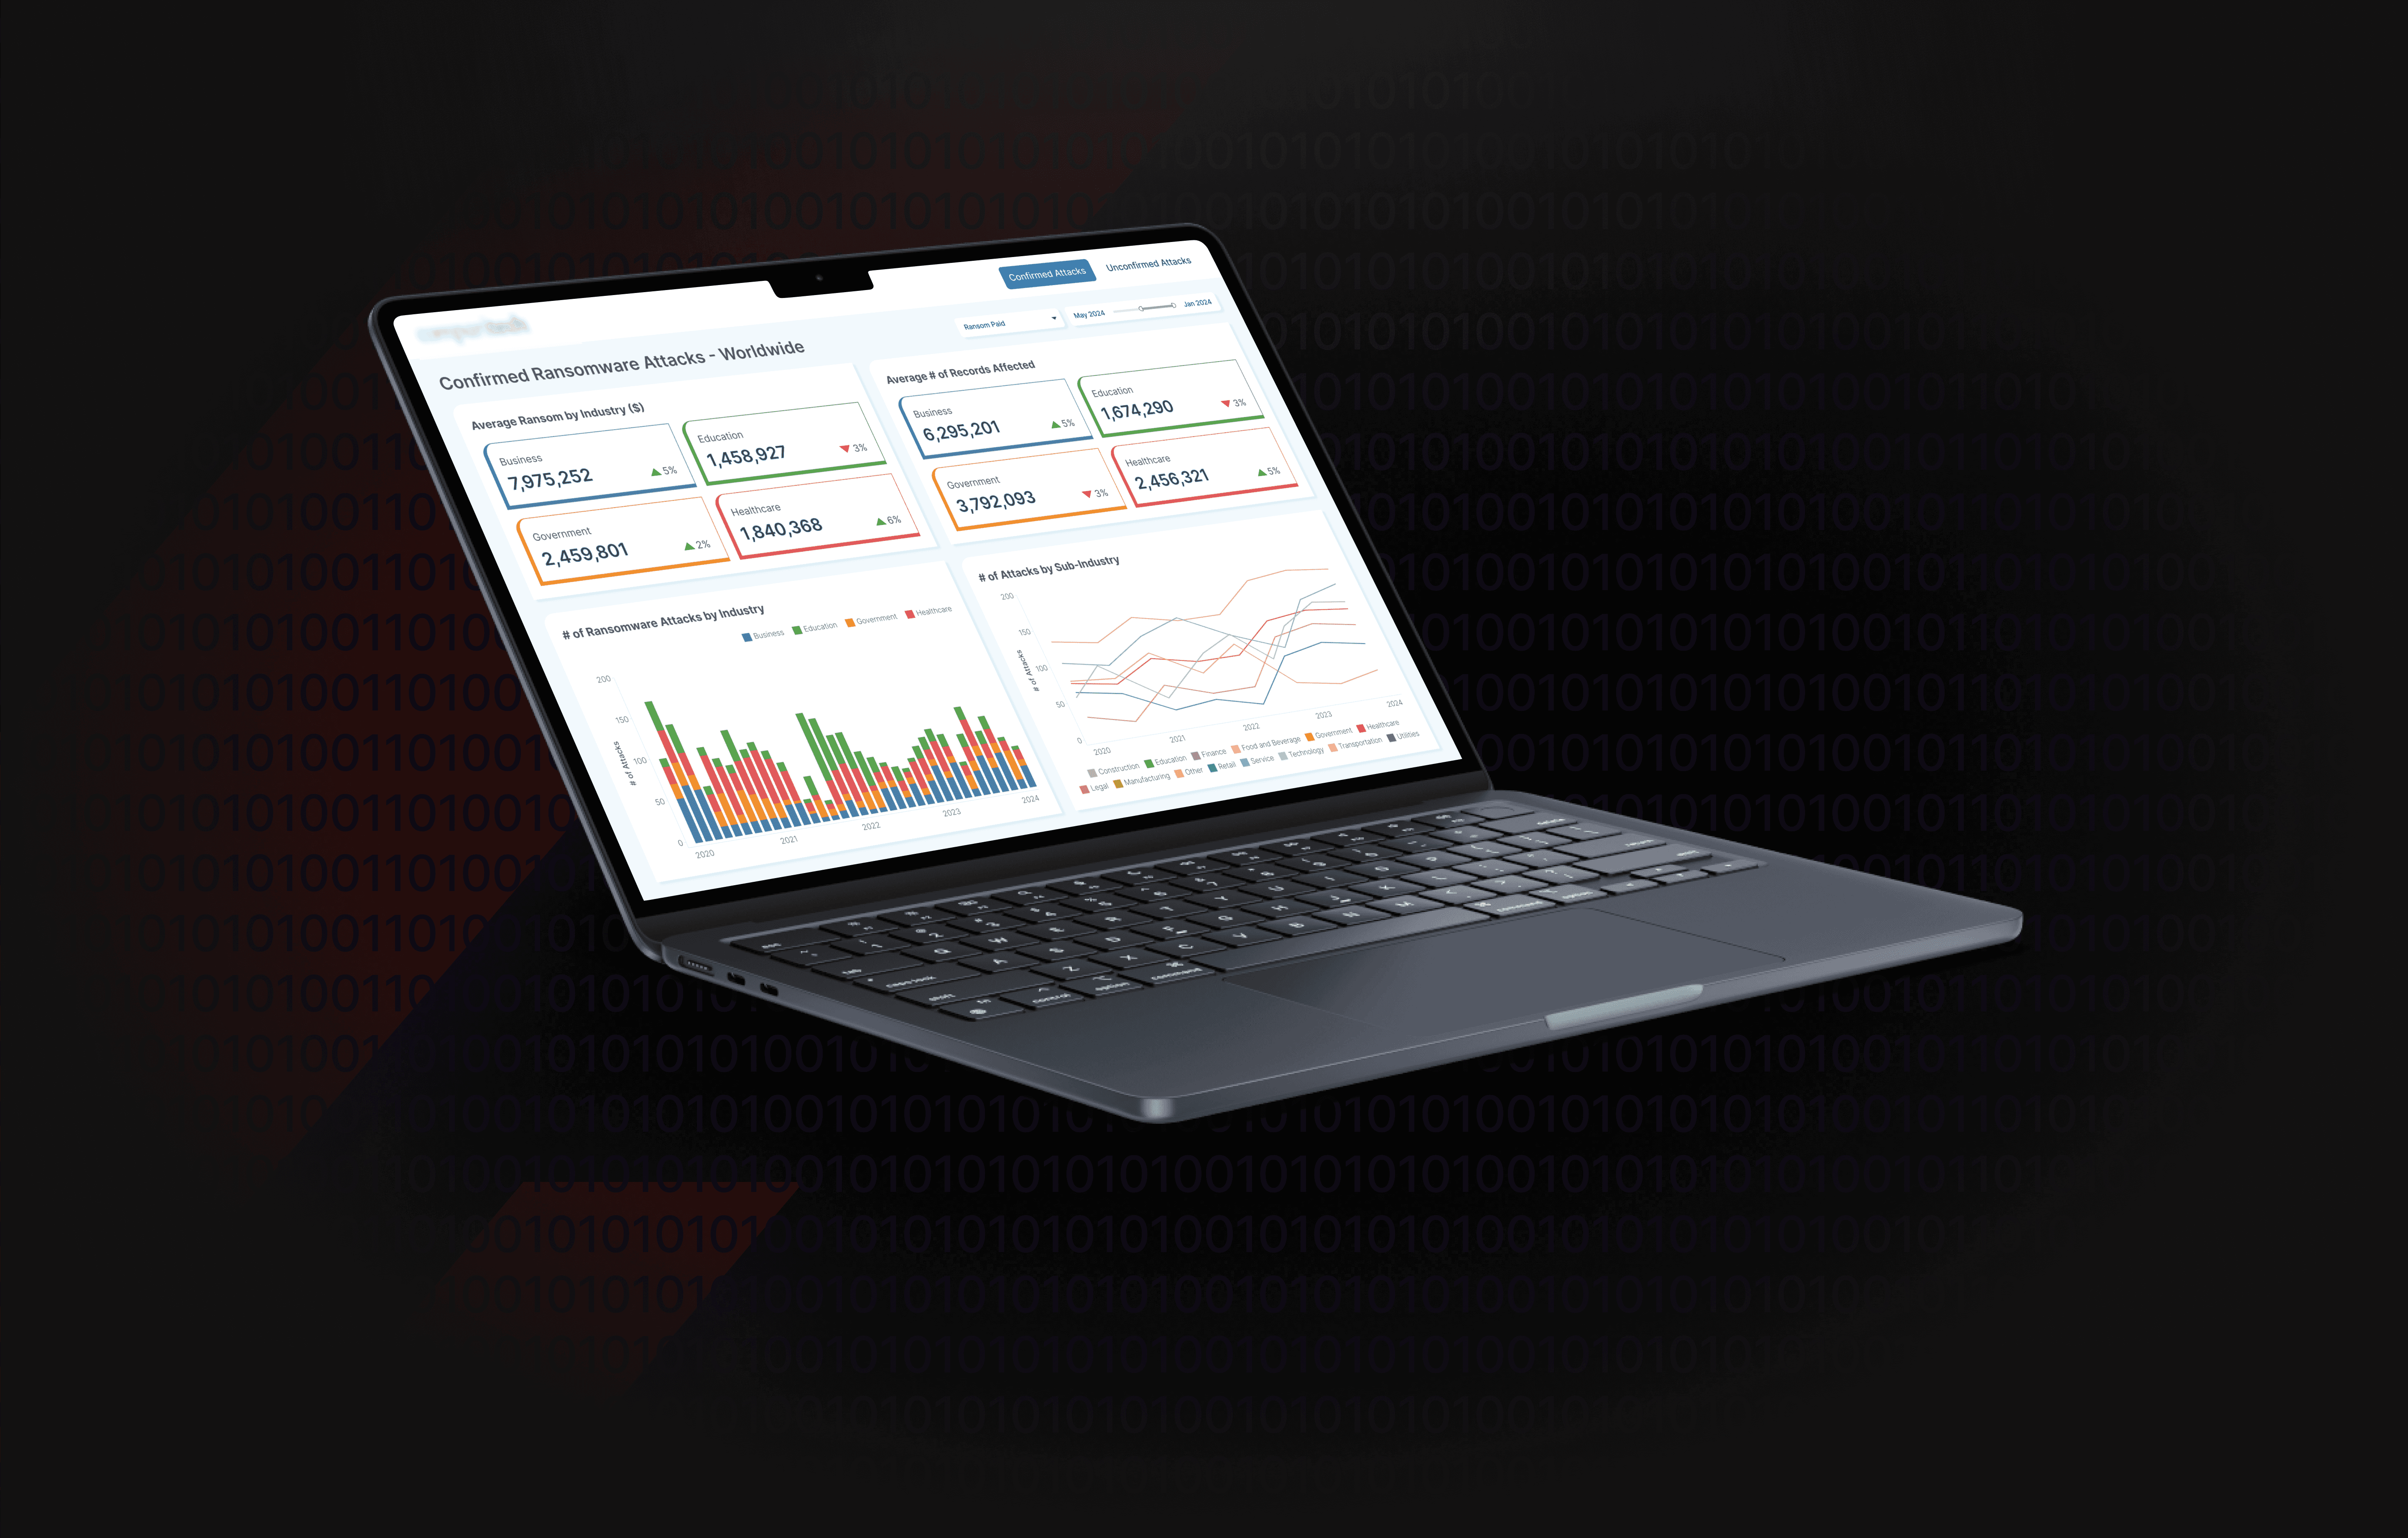
Real-Time Ransomware Monitoring Dashboard
Helping Comparitech deliver continuous, high-performance ransomware insights that accelerate threat response and strengthen situational awareness.
Client
Comparitech
Timeline
50-200
Location
New York, USA

Client Overview
Comparitech is a respected UK-based cybersecurity research firm specializing in in-depth reviews of security tools, privacy services, and emerging threat landscapes. With a global audience relying on its unbiased analysis, Comparitech needed to extend its offerings into real-time threat monitoring—particularly for the rapidly evolving ransomware sector.
As ransomware incidents grew both in volume and sophistication, Comparitech recognized that static reports and periodic blog updates were no longer sufficient. The team sought a dynamic solution to surface critical insights the moment they emerged, reinforcing its reputation as a thought leader in cybersecurity intelligence.
—————————————————————————————————————
Challenge
Existing monitoring approaches forced analysts to pull data from multiple feeds—OSINT aggregators, incident trackers, and newsletter digests—then manually reconcile and validate each entry. This fragmented process introduced delays of hours or even days before a confirmed attack could be highlighted, hampering Comparitech’s promise of timely advisories.
On top of that, off-the-shelf dashboard tools choked under the weight of high-velocity ransomware feeds, causing slow queries and timeouts precisely when analysts needed speed. Without a scalable, performant interface to categorize “Confirmed” versus “Unconfirmed” incidents, critical threats risked slipping through the cracks.
—————————————————————————————————————
Objective
Design and implement an end-to-end ransomware monitoring system that continuously ingests live incident data, automates threat validation, and presents a clean, high-performance Tableau dashboard. This platform must empower analysts to filter, drill into, and share actionable insights within minutes of an attack’s discovery—while maintaining sub-second responsiveness even under peak data loads.
—————————————————————————————————————
Solution
Real-Time Data Integration with Tableau
A streaming ETL pipeline was built using Python and Apache Kafka to capture and normalize feeds from multiple threat intelligence sources. These cleansed streams feed directly into Tableau’s Hyper extract engine, ensuring dashboards reflect the latest incident data with under 60 seconds of latency.
Automated Threat Classification Engine
Custom Python scripts apply rule-based logic and machine-learning heuristics to tag each ransomware event as “Confirmed” or “Unconfirmed.” This automated layer reduced manual triage by 70%, allowing analysts to focus exclusively on credible, high-risk incidents.
Performance-Tuned Data Architecture
Dashboards were optimized through strategic Hyper partitioning, indexed views, and pre-aggregations. As a result, even datasets exceeding 500,000 records render in under one second, delivering a fluid user experience regardless of query complexity.
Intuitive, Analyst-Centric Dashboard Design
A clean layout emphasizes key KPIs—attack counts, average ransom amounts, and geographic heatmaps—while offering drill-down filters by industry, region, and time window. Contextual tooltips and alert badges guide users to critical insights without overwhelming them.
—————————————————————————————————————
Impact
25% Reduction in Mean Time to Detect
By automating ingestion and classification, threat detection latency shrank by a quarter—from four hours down to three—enabling faster escalation and containment guidance.
5× Expansion of Validated Incident Coverage
Automated classification unlocked visibility into five times more confirmed ransomware events per day, broadening Comparitech’s intelligence footprint without adding headcount.
1,500 Analyst Hours Saved Annually
Eliminating manual data consolidation and report drafting freed more than 1,500 hours each year, allowing the team to focus on deep investigations and strategic commentary.
—————————————————————————————————————