Real-Time Investment Performance Dashboard
Unifying energy market intelligence for Caerus Commodities with a real-time, scalable dashboard that drives faster asset decisions and reporting precision.
Client
Caerus Commodities
Timeline
10-50
Location
New York, USA
Client Overview
Caerus Commodities is a next-generation energy merchant and asset investor focused on battery storage and energy trading strategies. With operations spanning New York and Austin, Caerus brings a data-first mindset to one of the world’s most volatile and opportunity-rich markets. Their success depends on real-time intelligence, precise forecasting, and the ability to act faster than the competition.
—————————————————————————————————————
Challenge
As Caerus scaled, their data infrastructure struggled to keep pace. Key operational data—including state of charge, real-time dispatch instructions, market pricing, and weather feeds—was scattered across APIs, Excel files, and internal documents.
Without a centralized system, decision-making slowed, reporting cycles were manual and inconsistent, and performance visibility was fragmented. To continue innovating and growing, Caerus needed a dashboard that was real-time, reliable, and built to scale.
—————————————————————————————————————
Objective
Build an investment-grade, real-time dashboard that unifies internal and external data into a single platform. The goal: support live operations, eliminate manual reporting, and drive better portfolio-level decisions—all while future-proofing for additional data sources and asset types.
—————————————————————————————————————
Solution
Data Integration & Harmonization
Developed a custom ETL pipeline that aggregated data from diverse sources—including spreadsheets, APIs, and historical files—and standardized it into a unified, reliable structure.
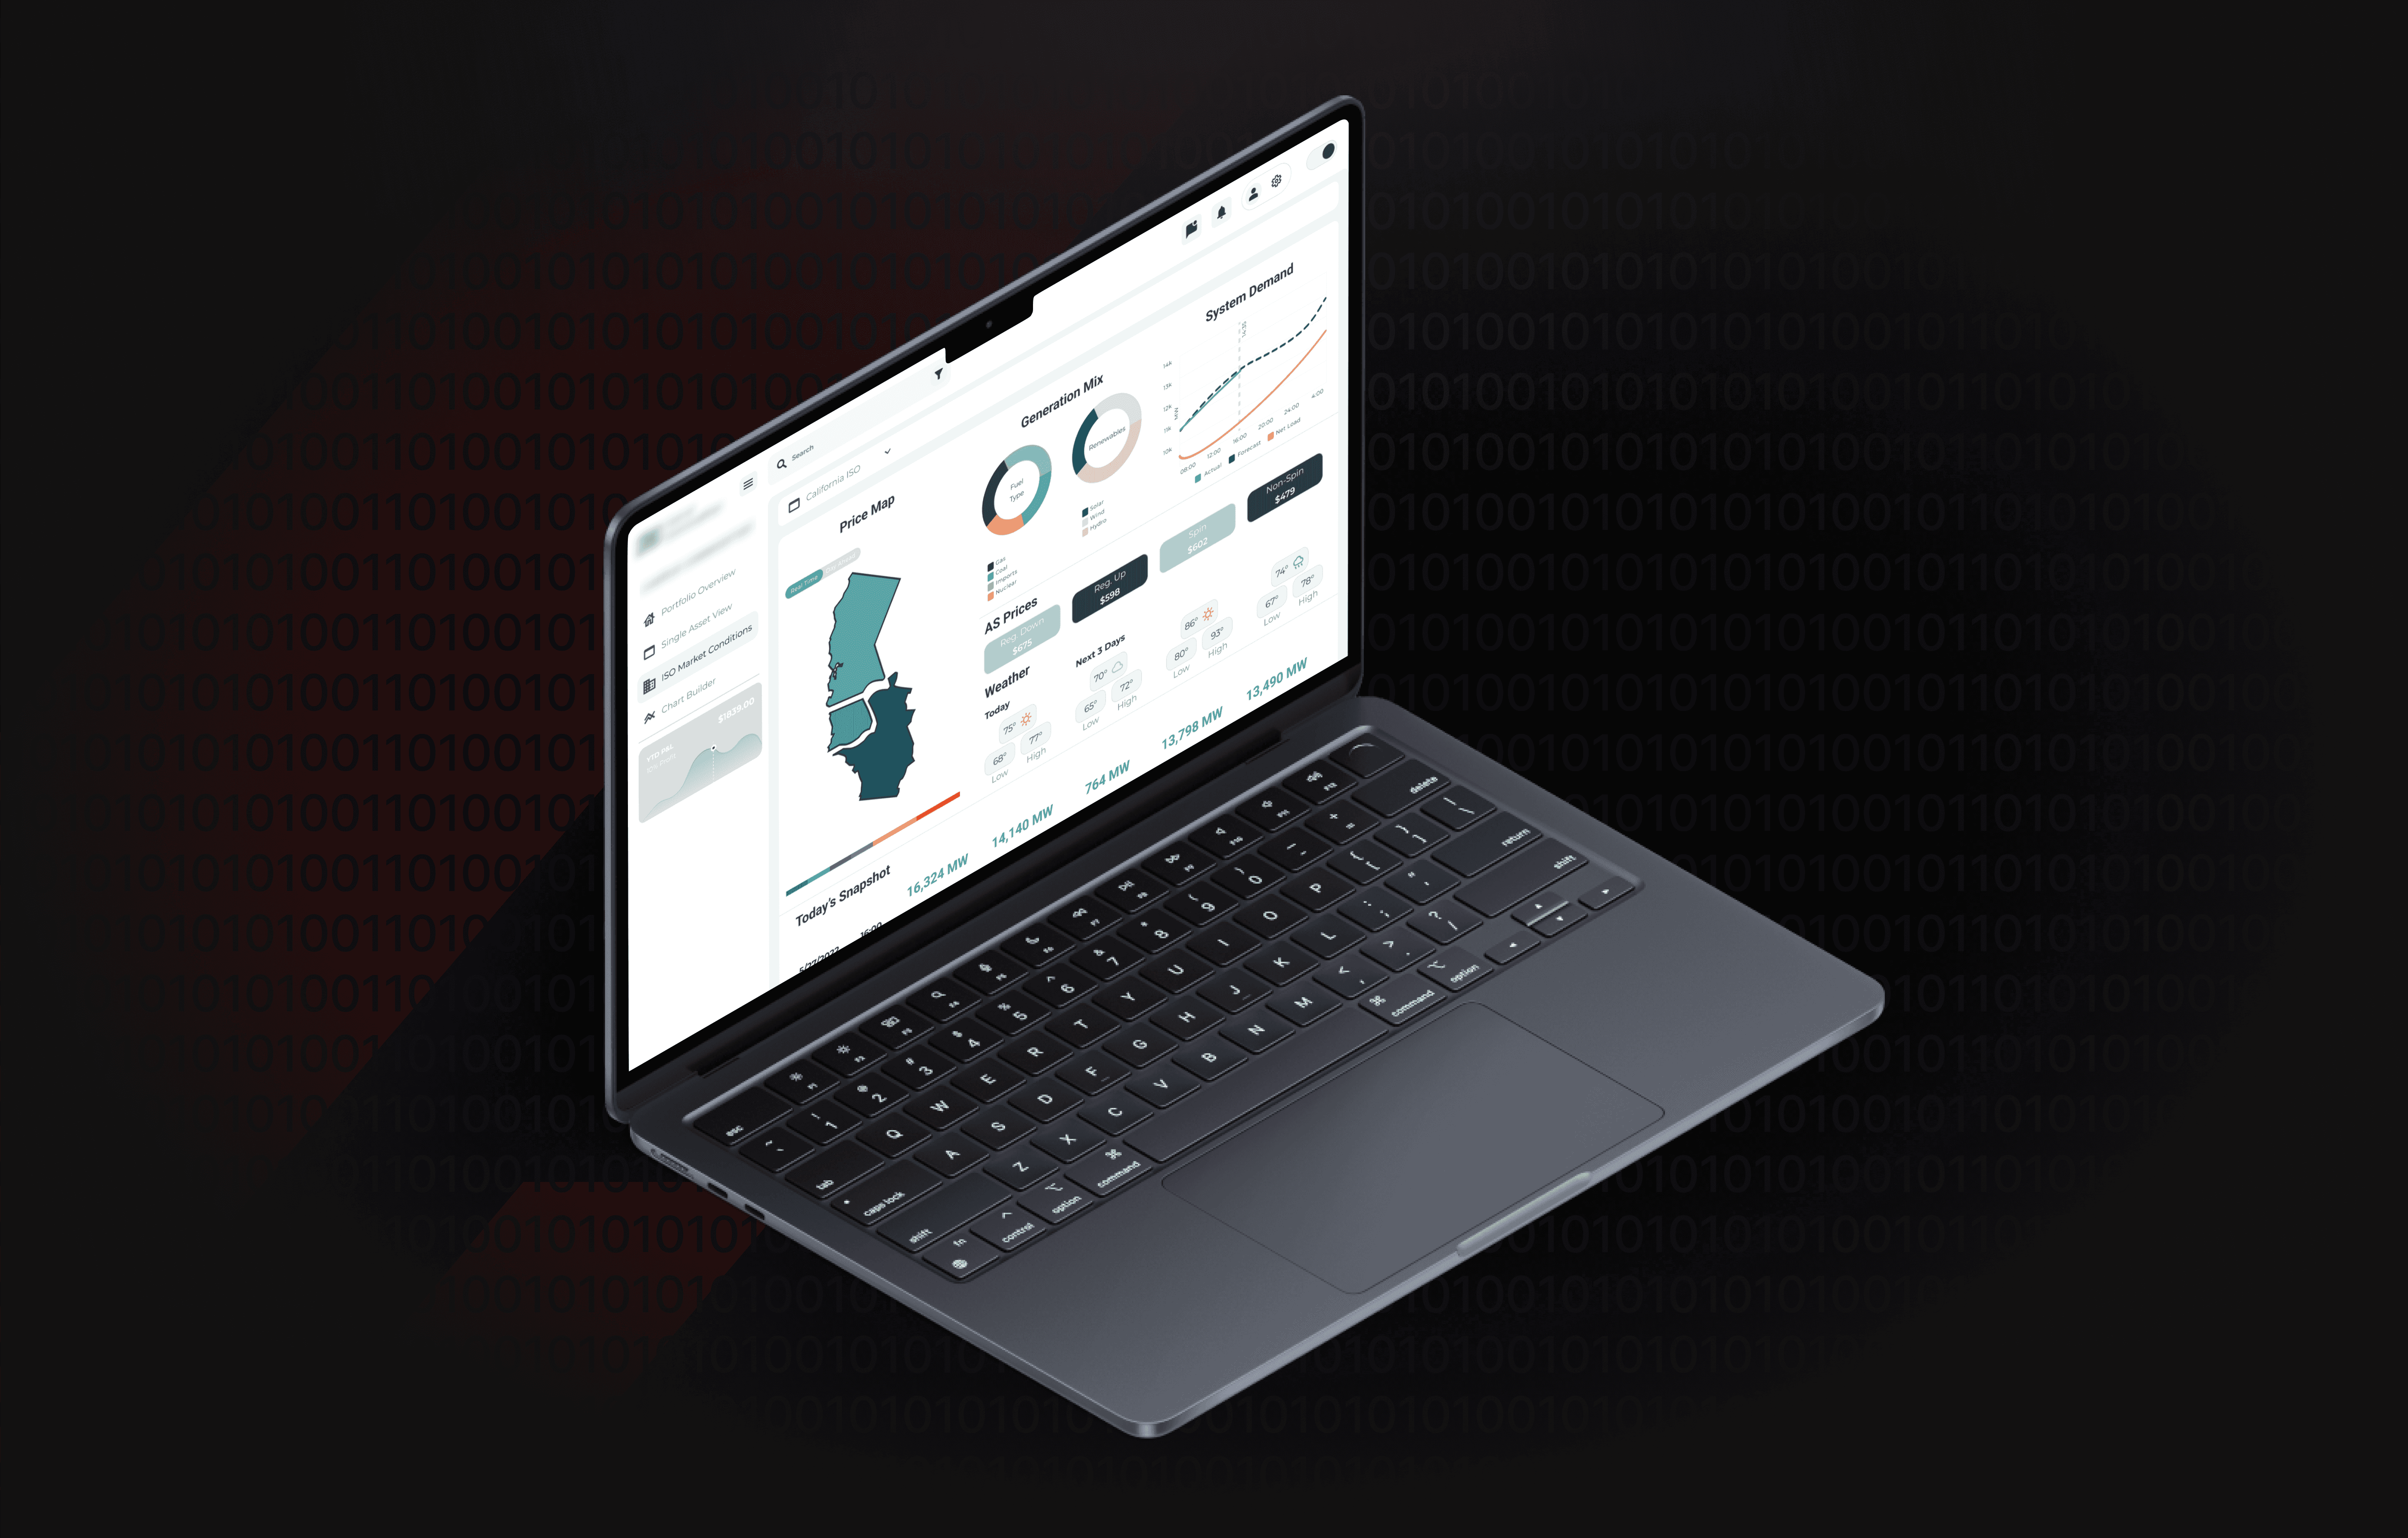
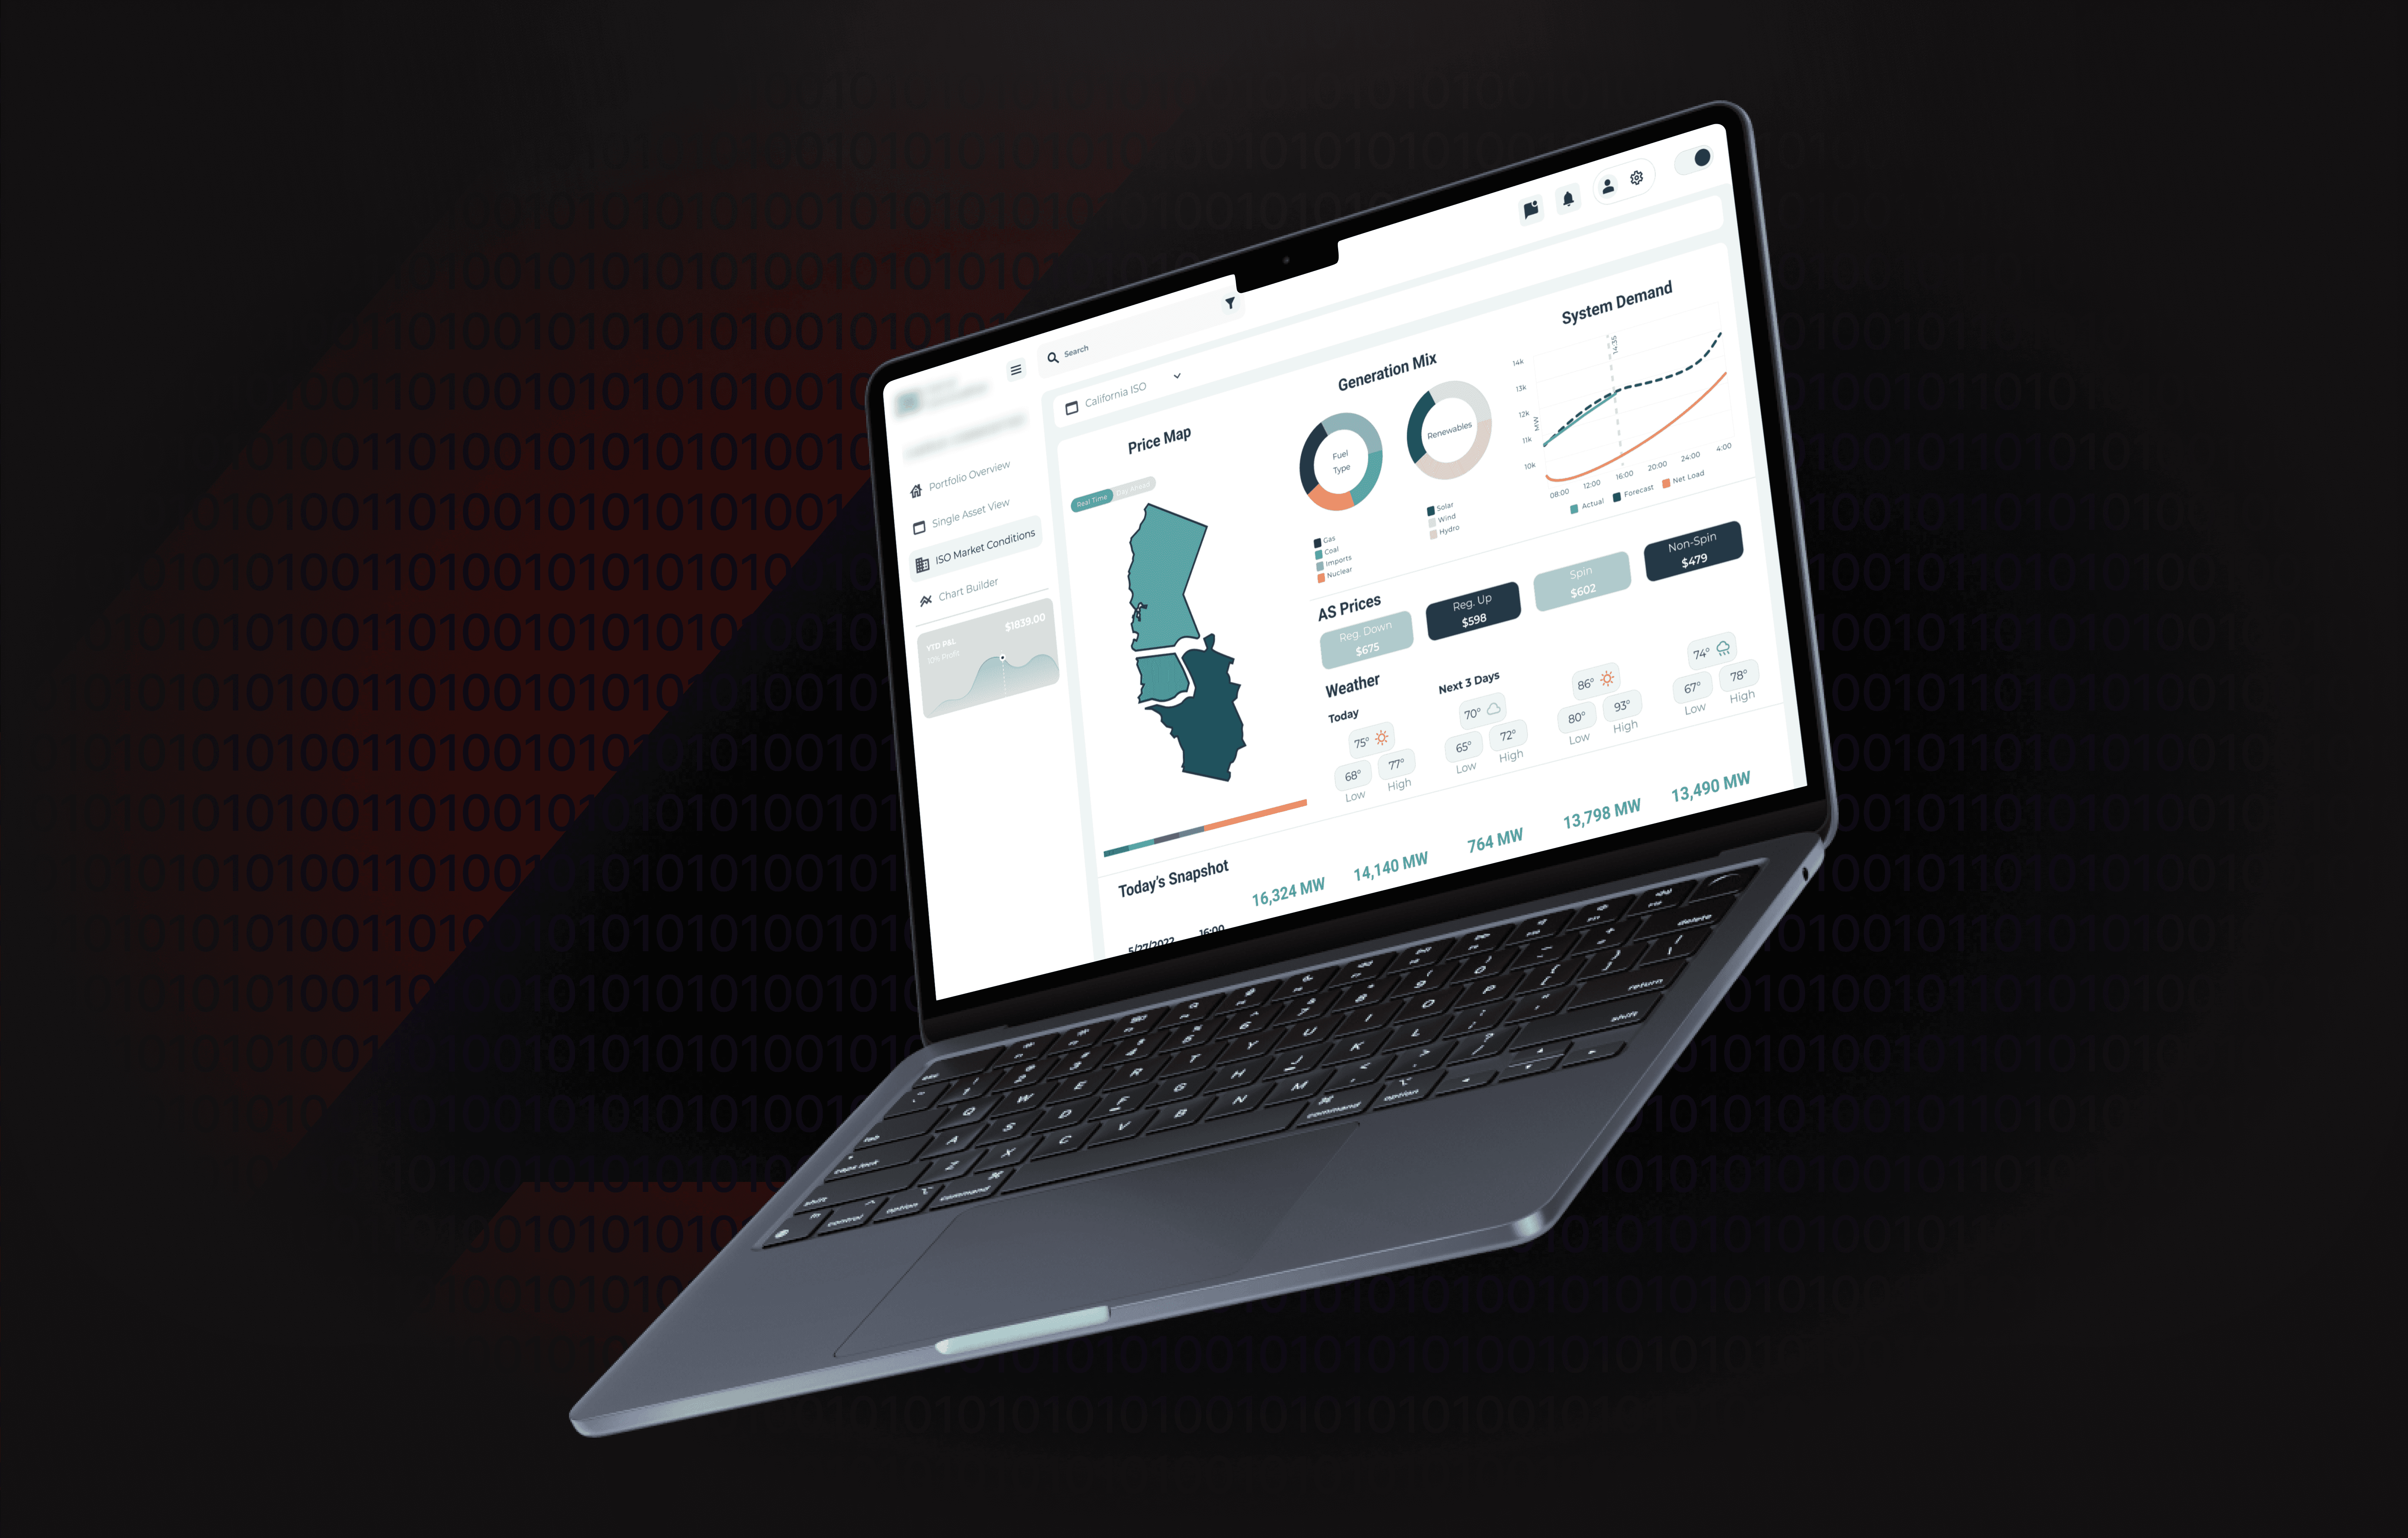
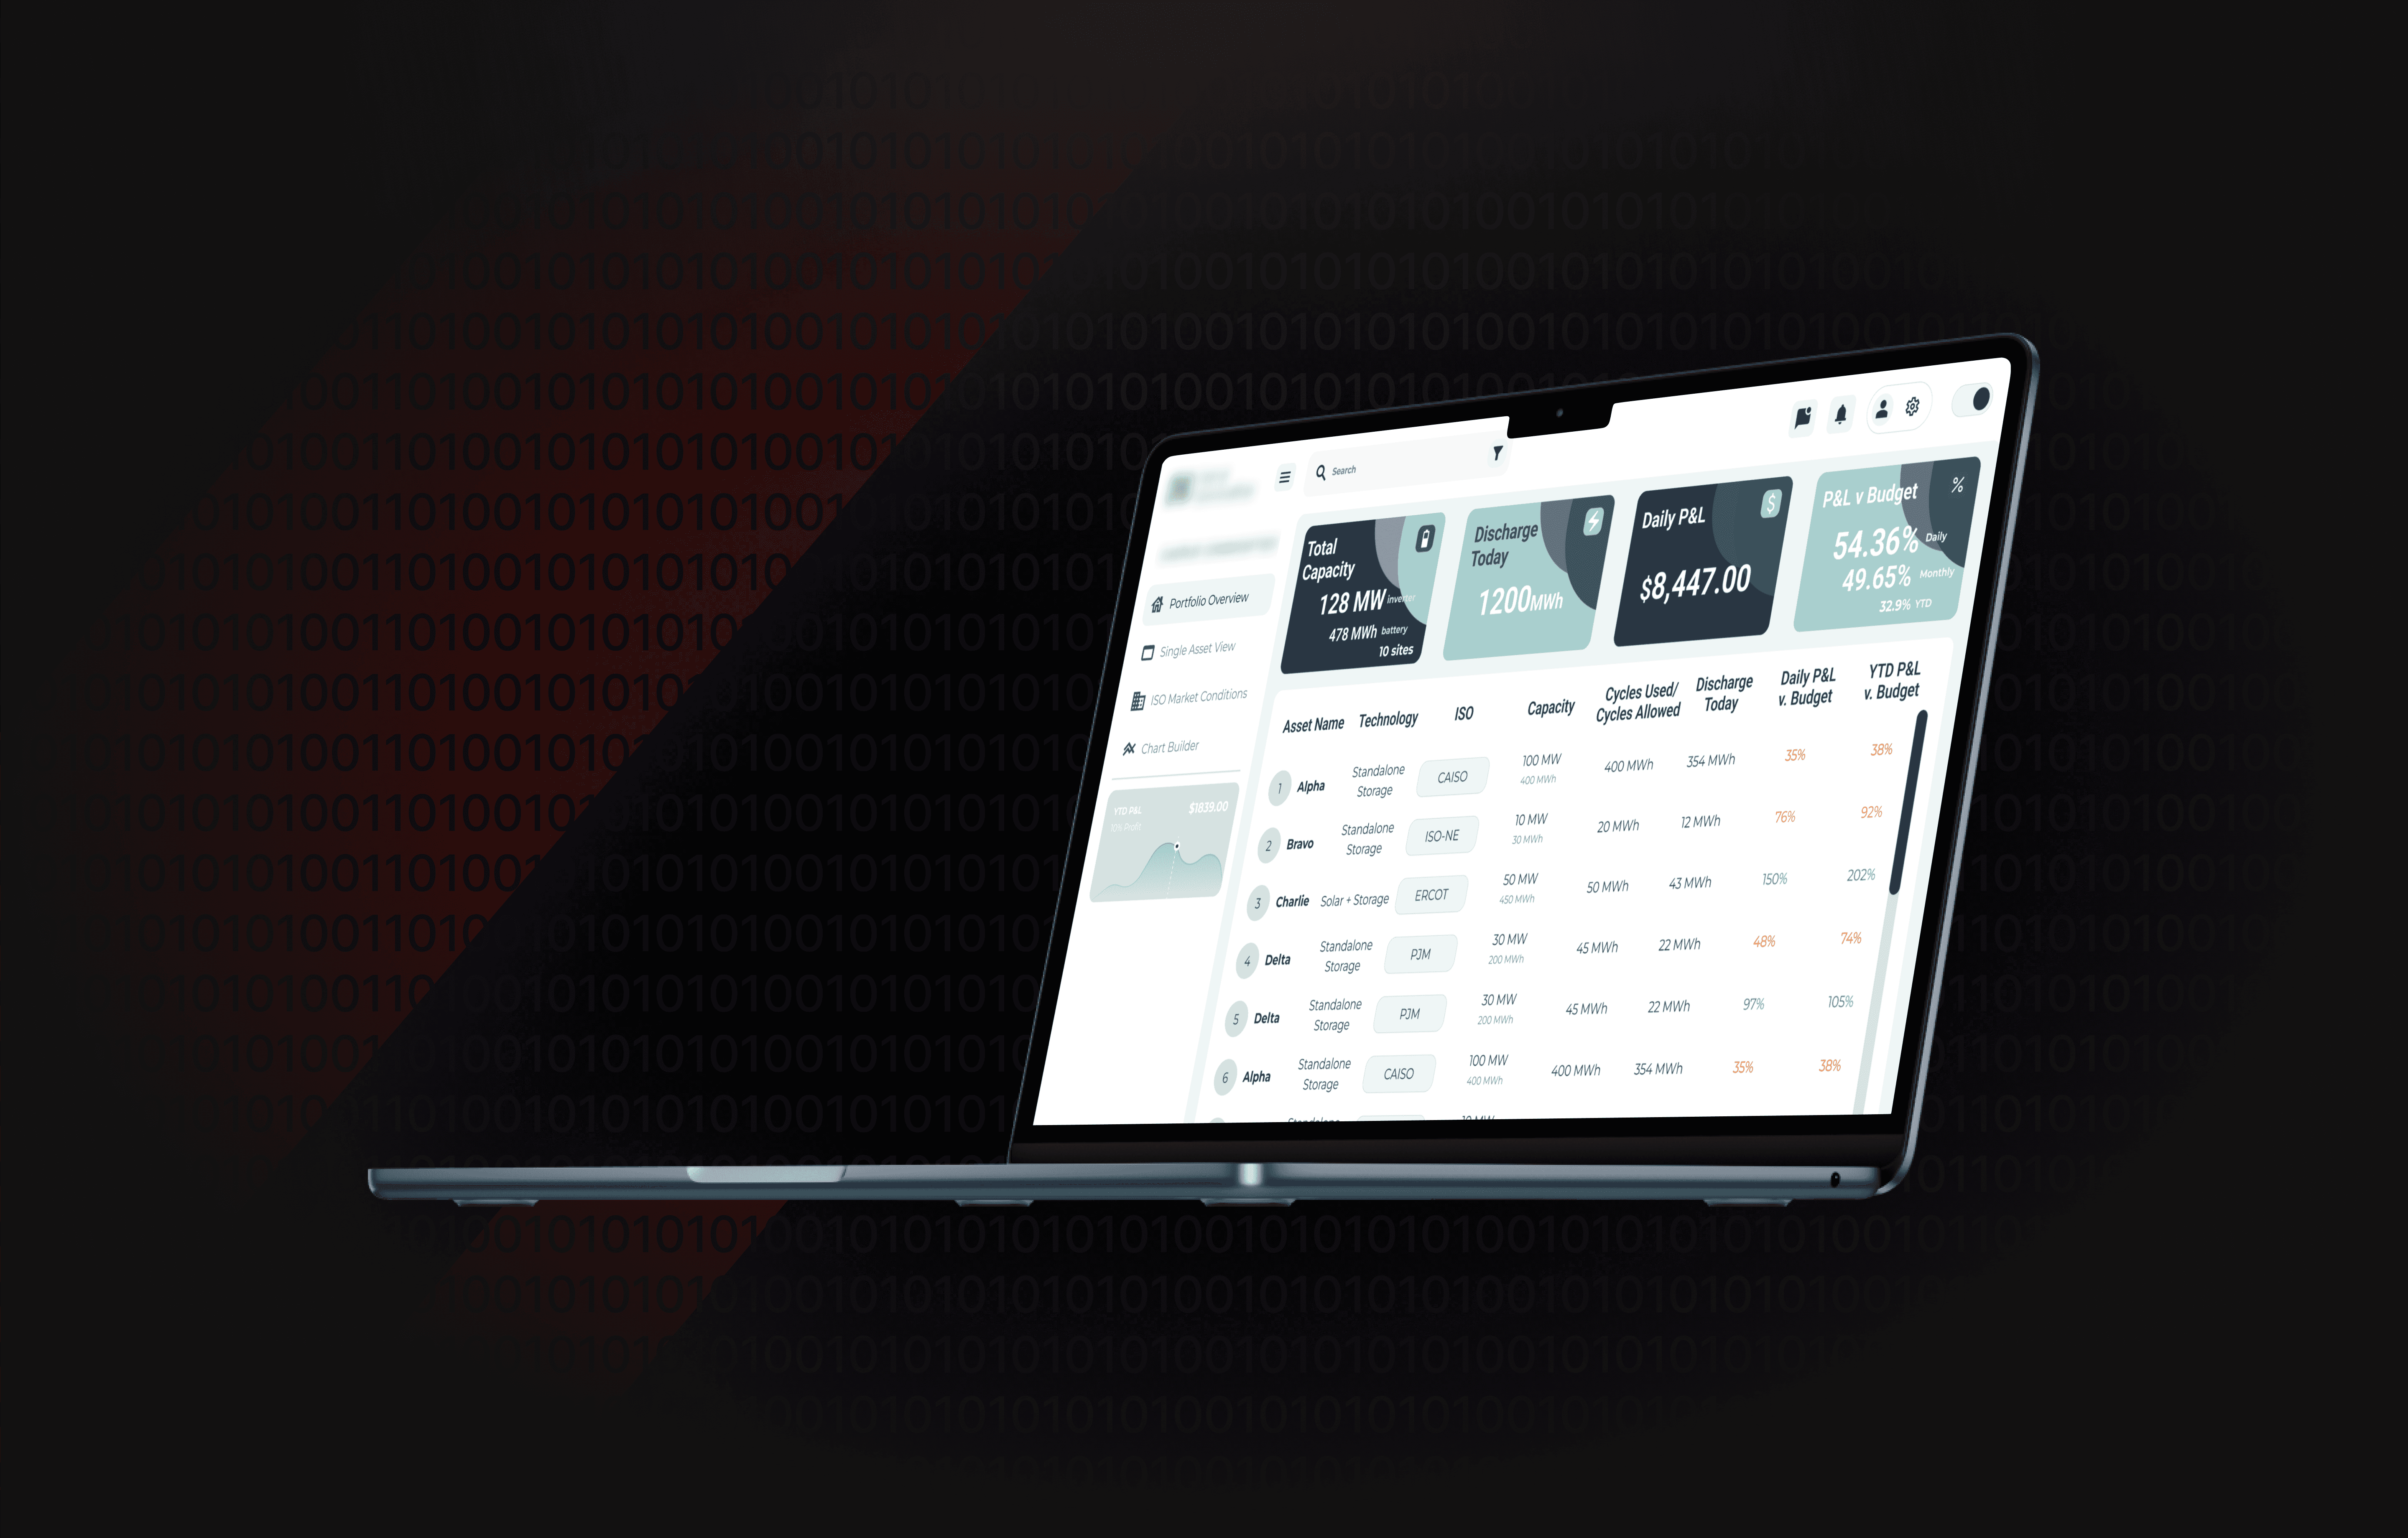
Live Performance Dashboard
Built a browser-based interface with real-time streaming widgets for battery asset KPIs: market price, state of charge, dispatch schedules, and weather data—all auto-refreshing and fully interactive.
Automated Reporting Layer
Implemented a reporting module to deliver stakeholder-ready reports on a daily, weekly, and monthly basis—reducing manual prep time and ensuring accuracy and timeliness.
Scalable Architecture
Designed a cloud-native, modular system that allows for future asset onboarding, geographic expansion, and analytics upgrades without requiring architectural changes.
—————————————————————————————————————
Impact
21% Increase in Data Accessibility
Teams gained faster access to reliable performance and market data, improving daily workflows and internal visibility.
19% Reduction in Manual Reporting Time
The automated report generation saved operations and analytics teams hundreds of hours per year previously spent on compiling and formatting performance reports.
8% Decrease in Operational Overhead
Eliminated redundant data tools and reduced reliance on external data wrangling services, cutting operational costs.