Real-Time Carbon Footprint Reporting Dashboard
Helping a climate-tech innovator, Empati AI, deliver real-time emissions data with precision dashboards that build trust and accelerate investor confidence.
Client
Empati AI
Timeline
25+
Location
New York, USA
Client Overview
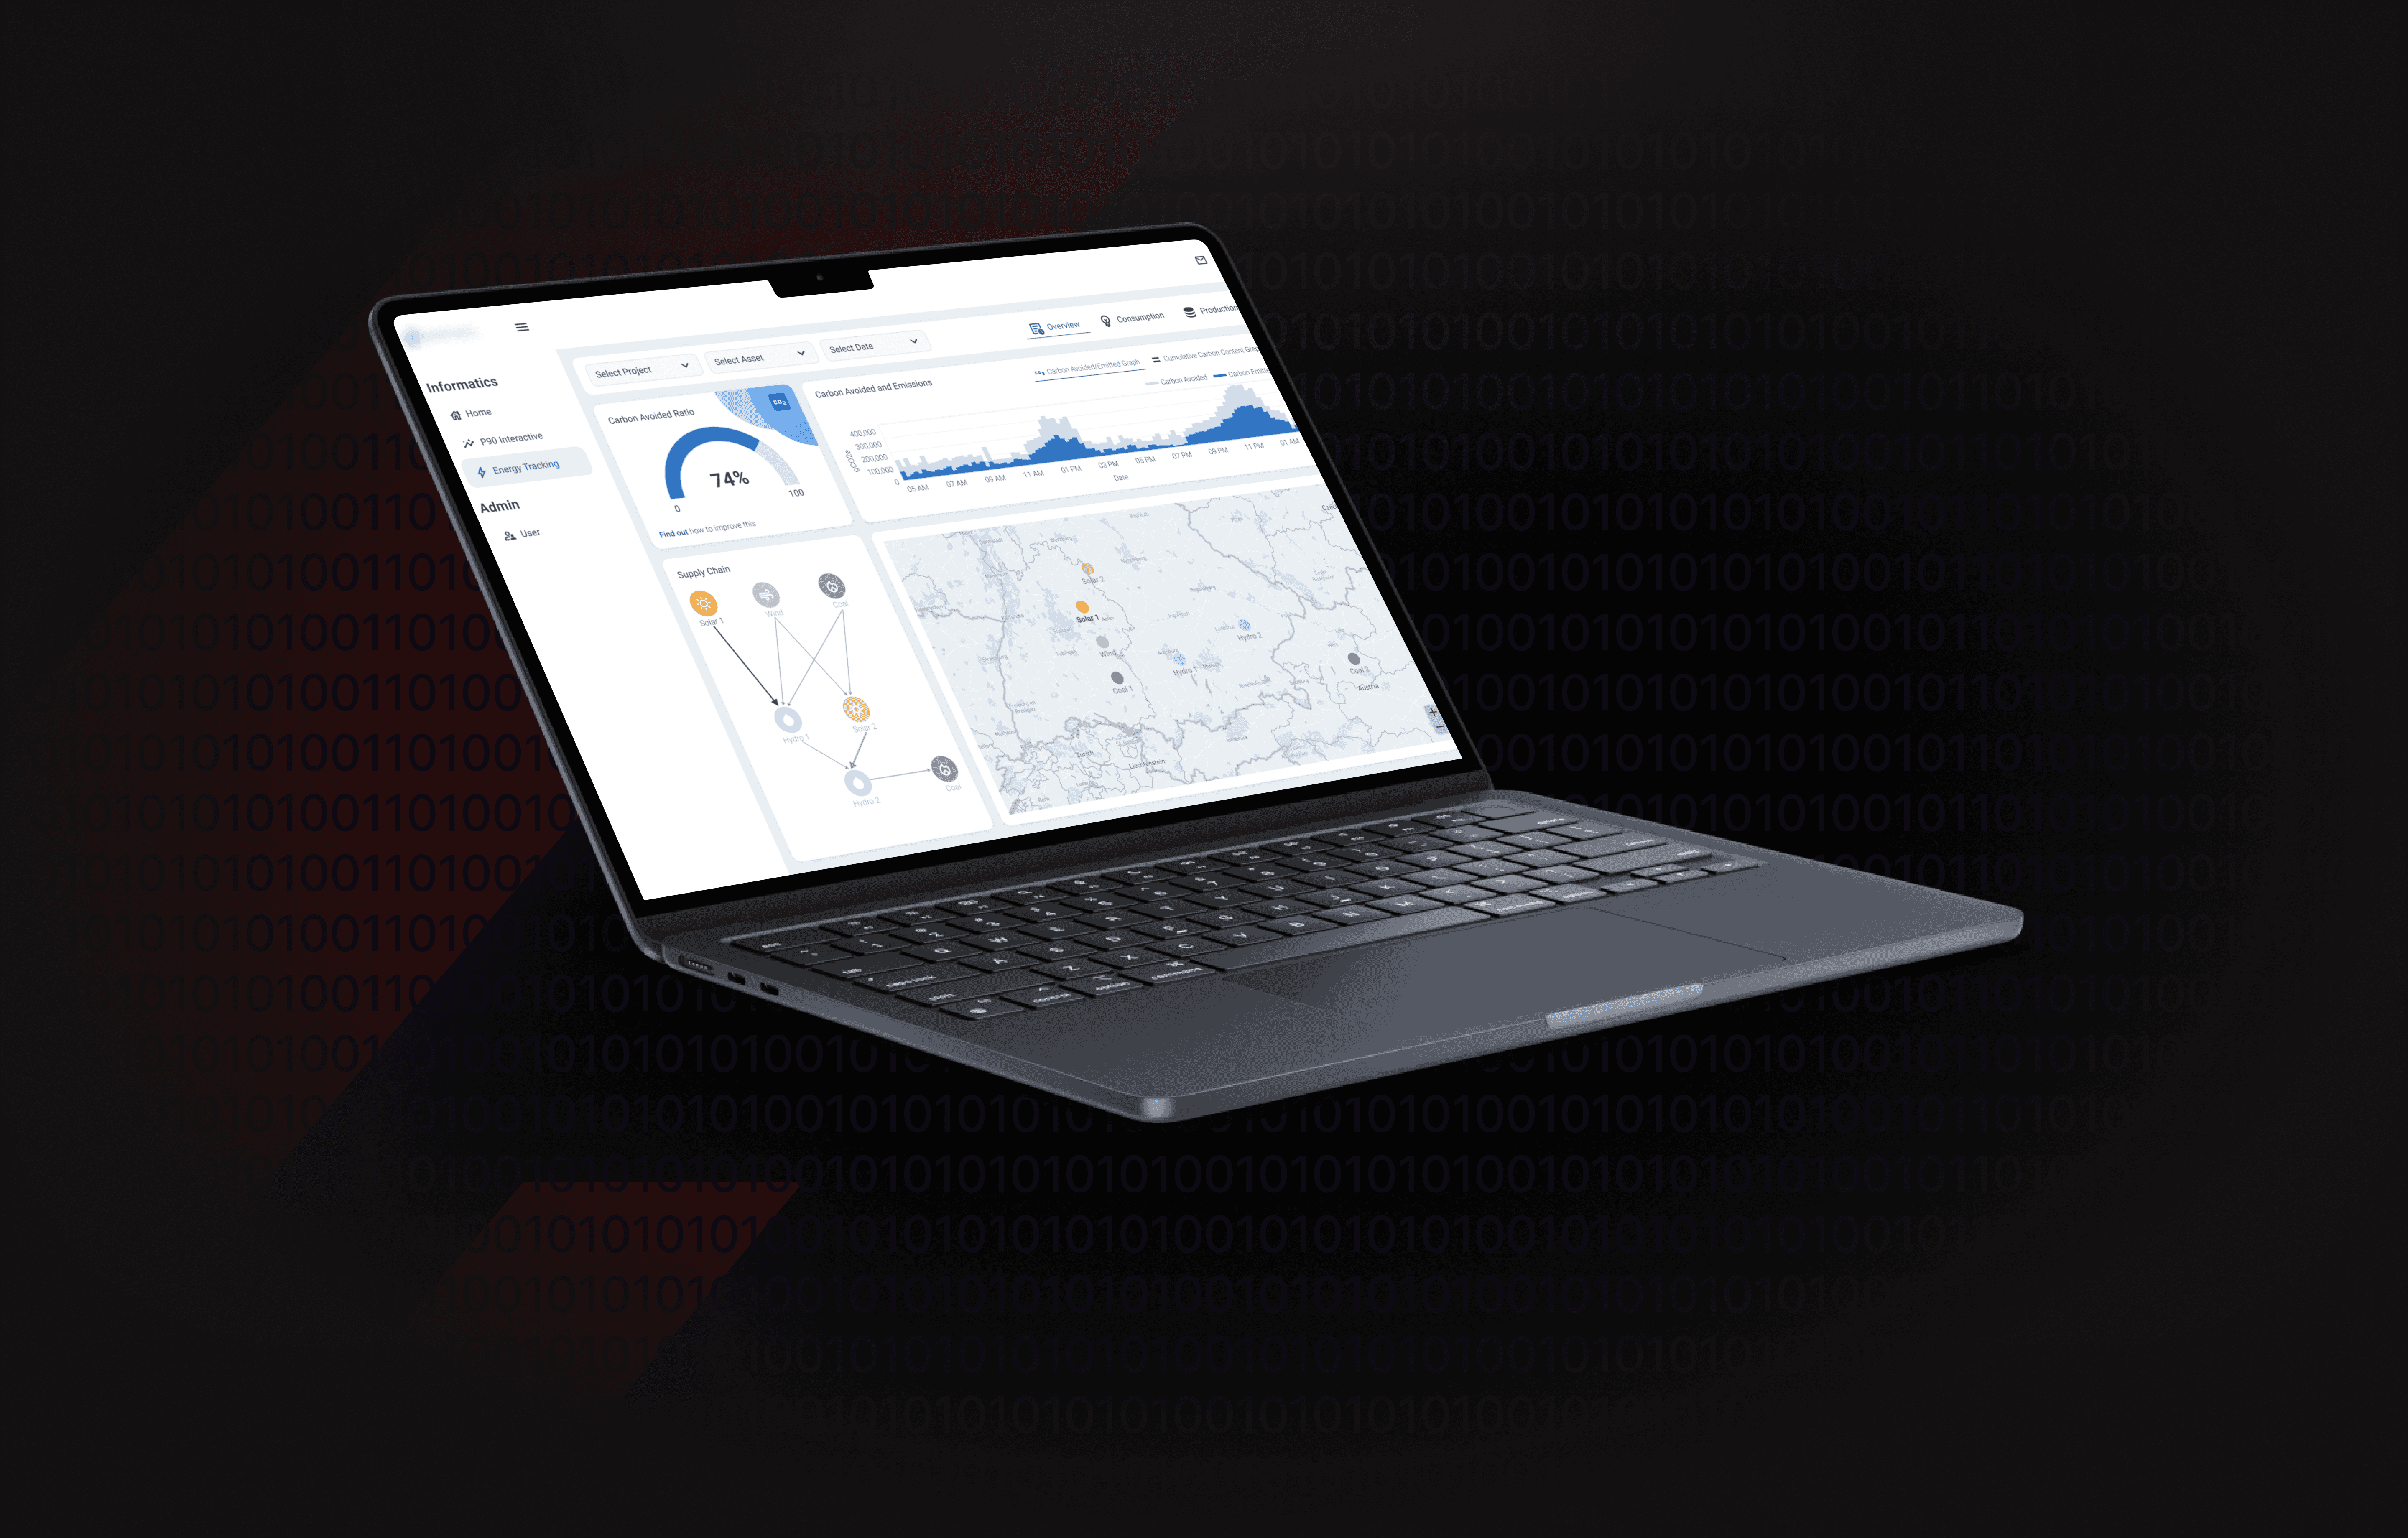
Empati AI is a UK-based climate-tech startup pioneering the next generation of carbon measurement. Their proprietary platform allows organizations to monitor emissions not just daily—but at hourly and even five-minute intervals. As the startup prepared to scale and attract institutional partners, they needed a data solution that could clearly convey the precision and innovation behind their technology.
Empati AI partnered with Vizio AI to build a powerful dashboard that transformed raw environmental data into an accessible, high-frequency decision tool—ready for both internal stakeholders and investor presentations.
—————————————————————————————————————
Challenge
Empati AI’s core innovation—real-time carbon tracking—posed unique technical challenges. Their dataset updated every five minutes, far exceeding the capacity of standard dashboard tools. The team needed to visualize complex environmental metrics without performance issues or misrepresentation.
At the same time, their in-house team had deep domain expertise but lacked UI/UX resources to design a dashboard that could translate dense scientific outputs into readable insights for non-technical users.
—————————————————————————————————————
Objective
Develop a responsive, real-time dashboard that accurately visualizes Empati AI’s five-minute carbon footprint data and positions the product as a credible, investor-ready platform for sustainability leaders and corporate clients.
—————————————————————————————————————
Solution
Custom Visualization Engine
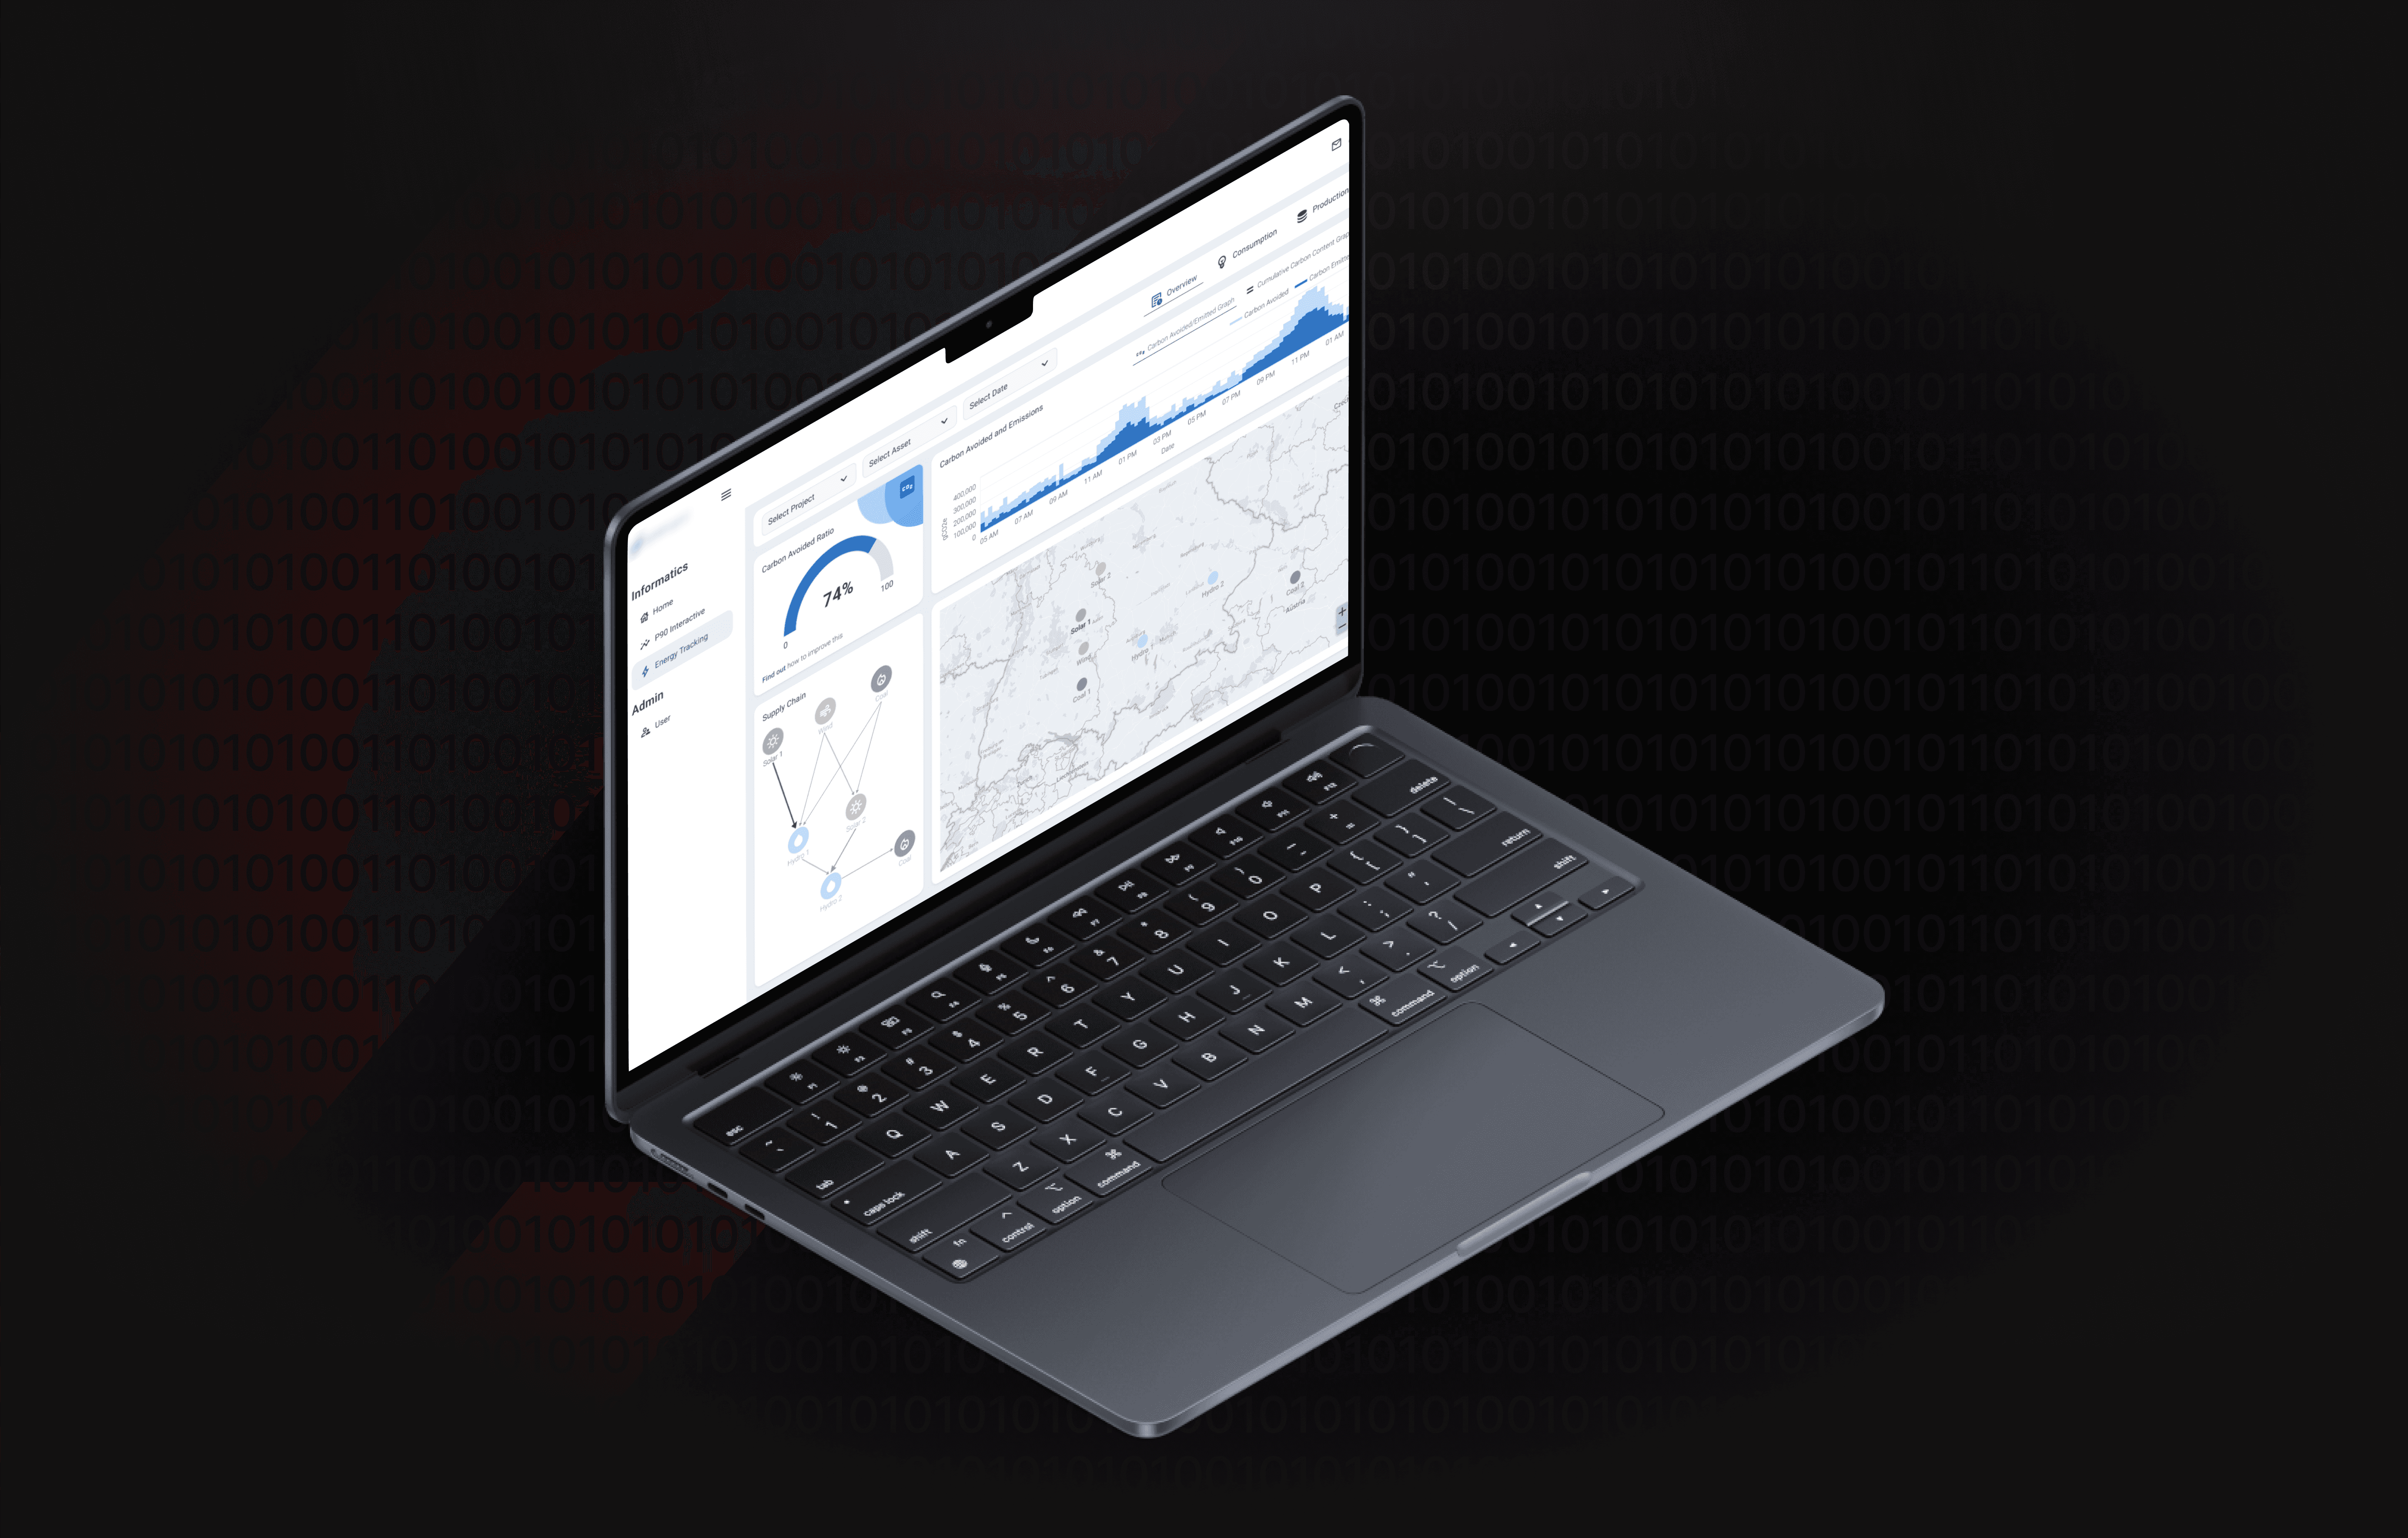
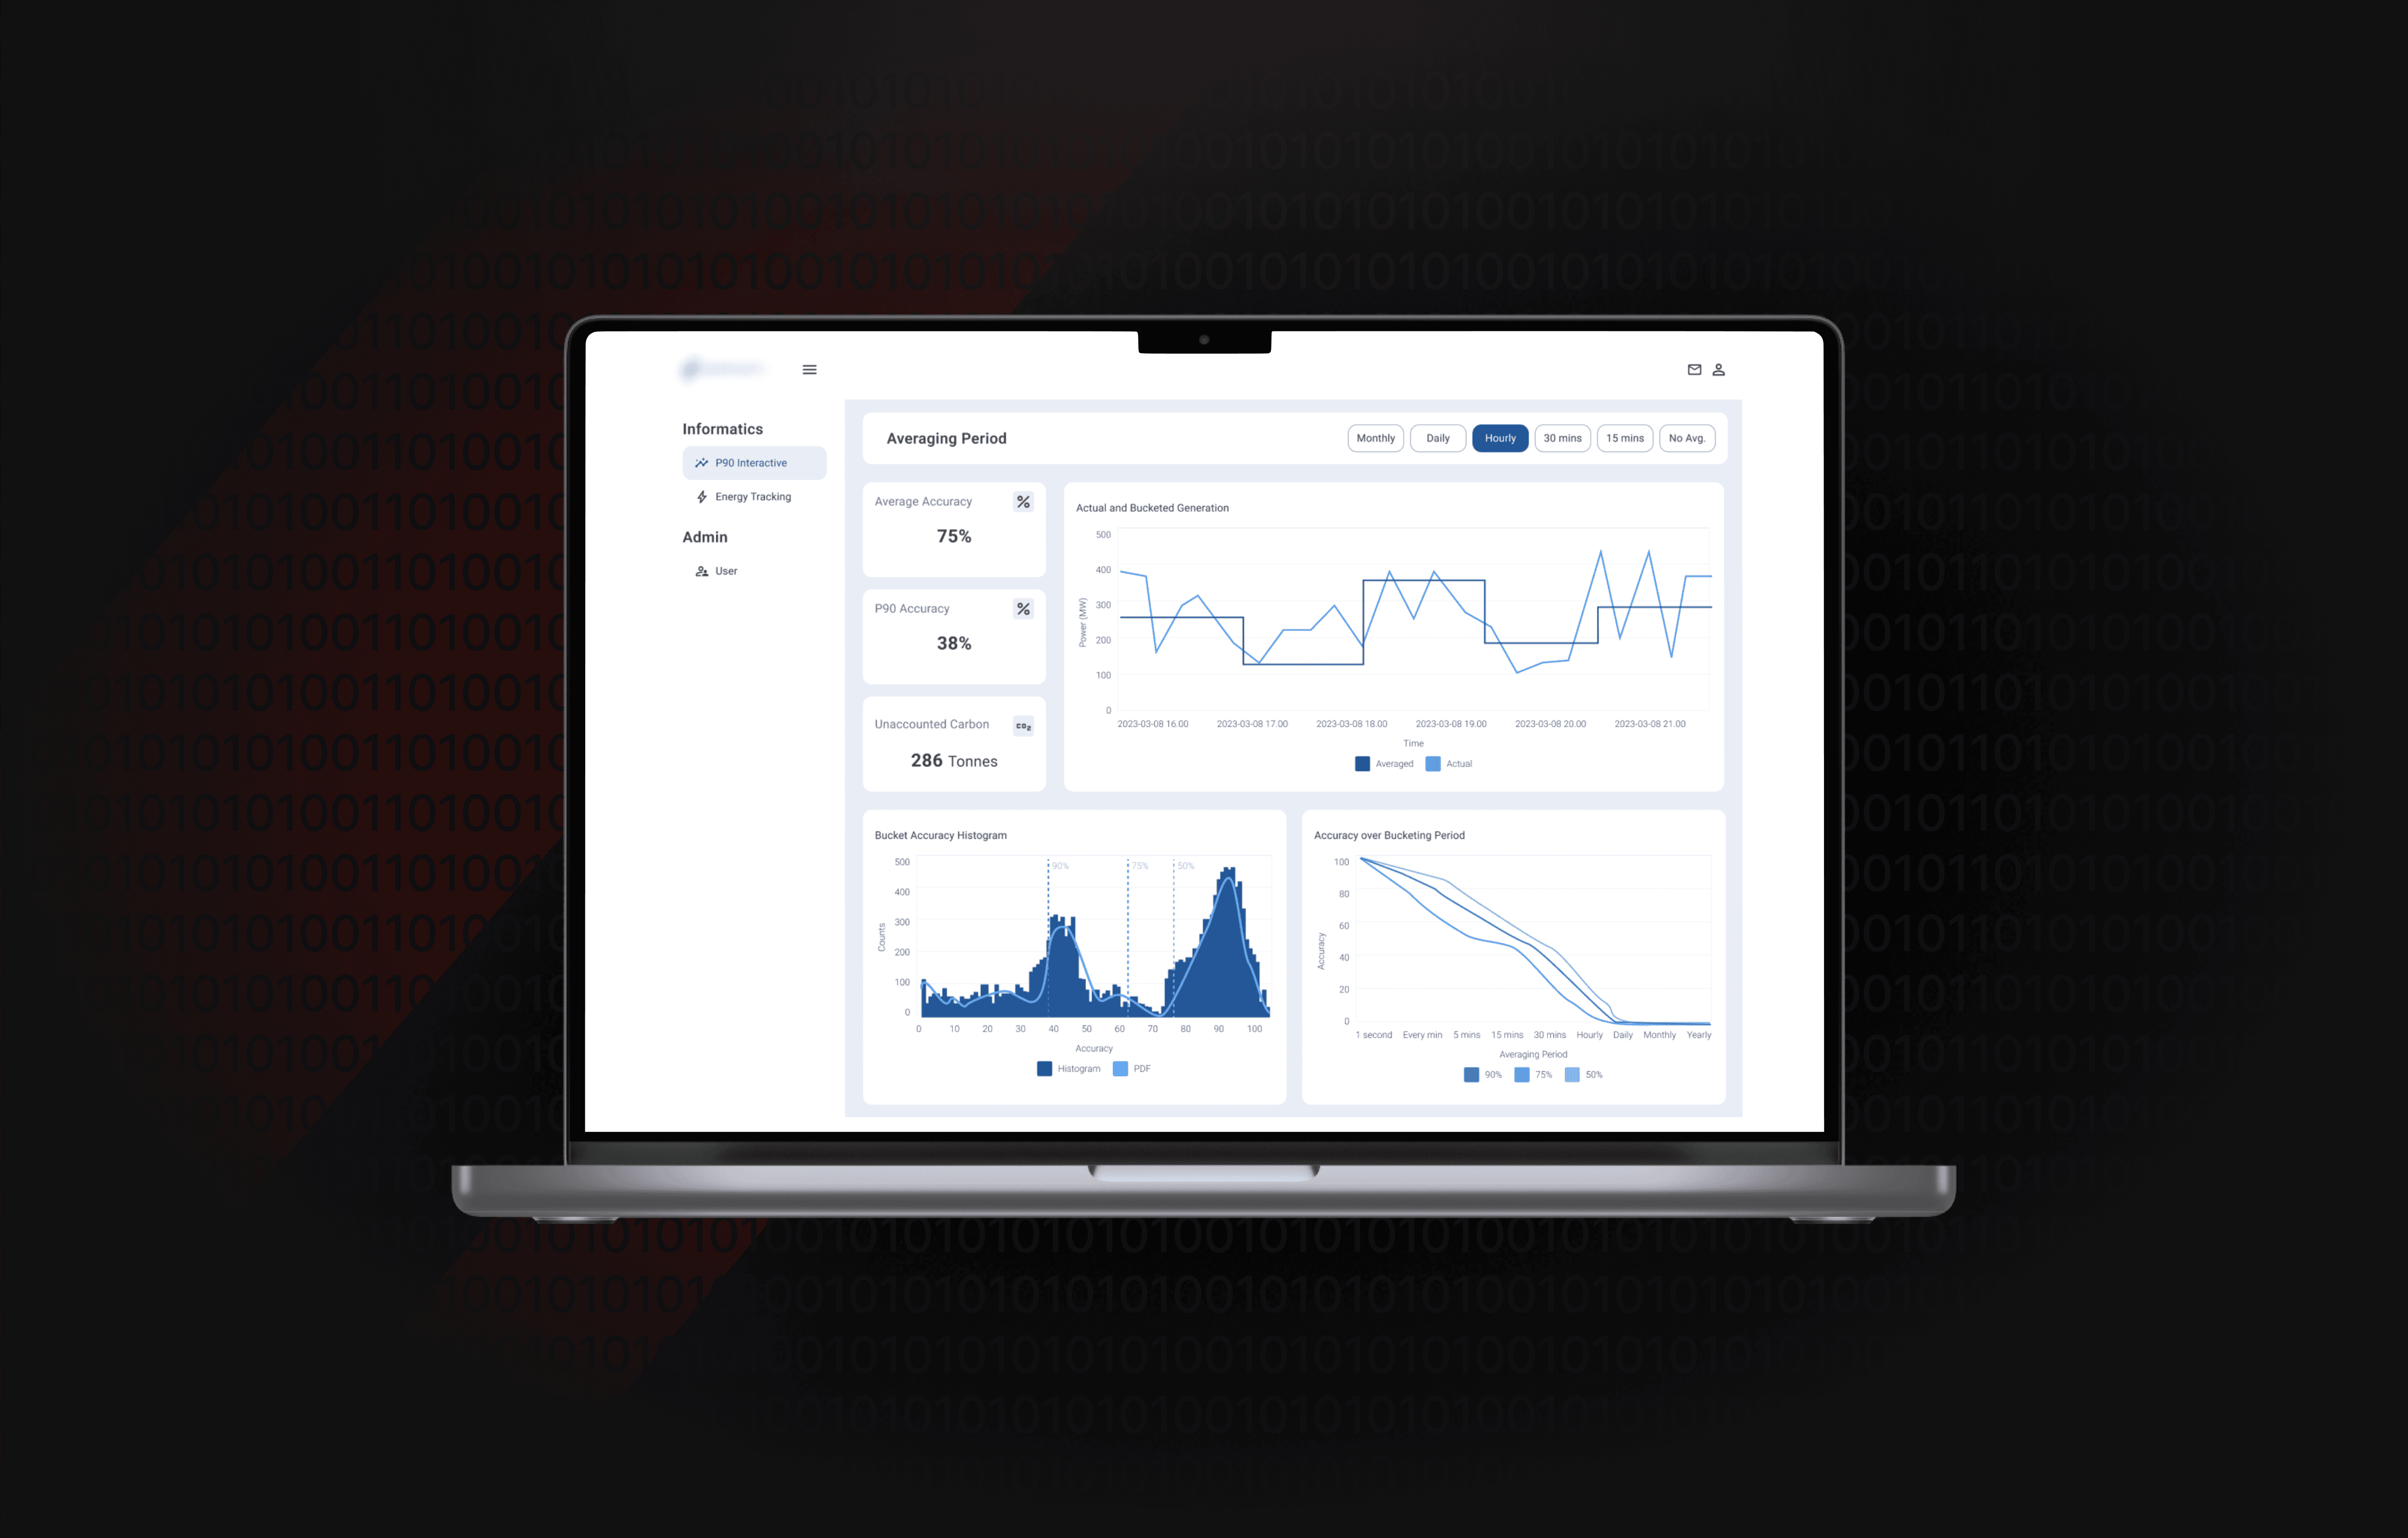
We built bespoke plots and data modules using Dash and Plotly to handle large volumes of five-minute interval data with clarity and flexibility.
Real-Time API Integration
Our team connected to Empati AI’s internal API using Flask and Docker, enabling continuous updates and live reflection of emissions data.
Collaborative Domain Modeling
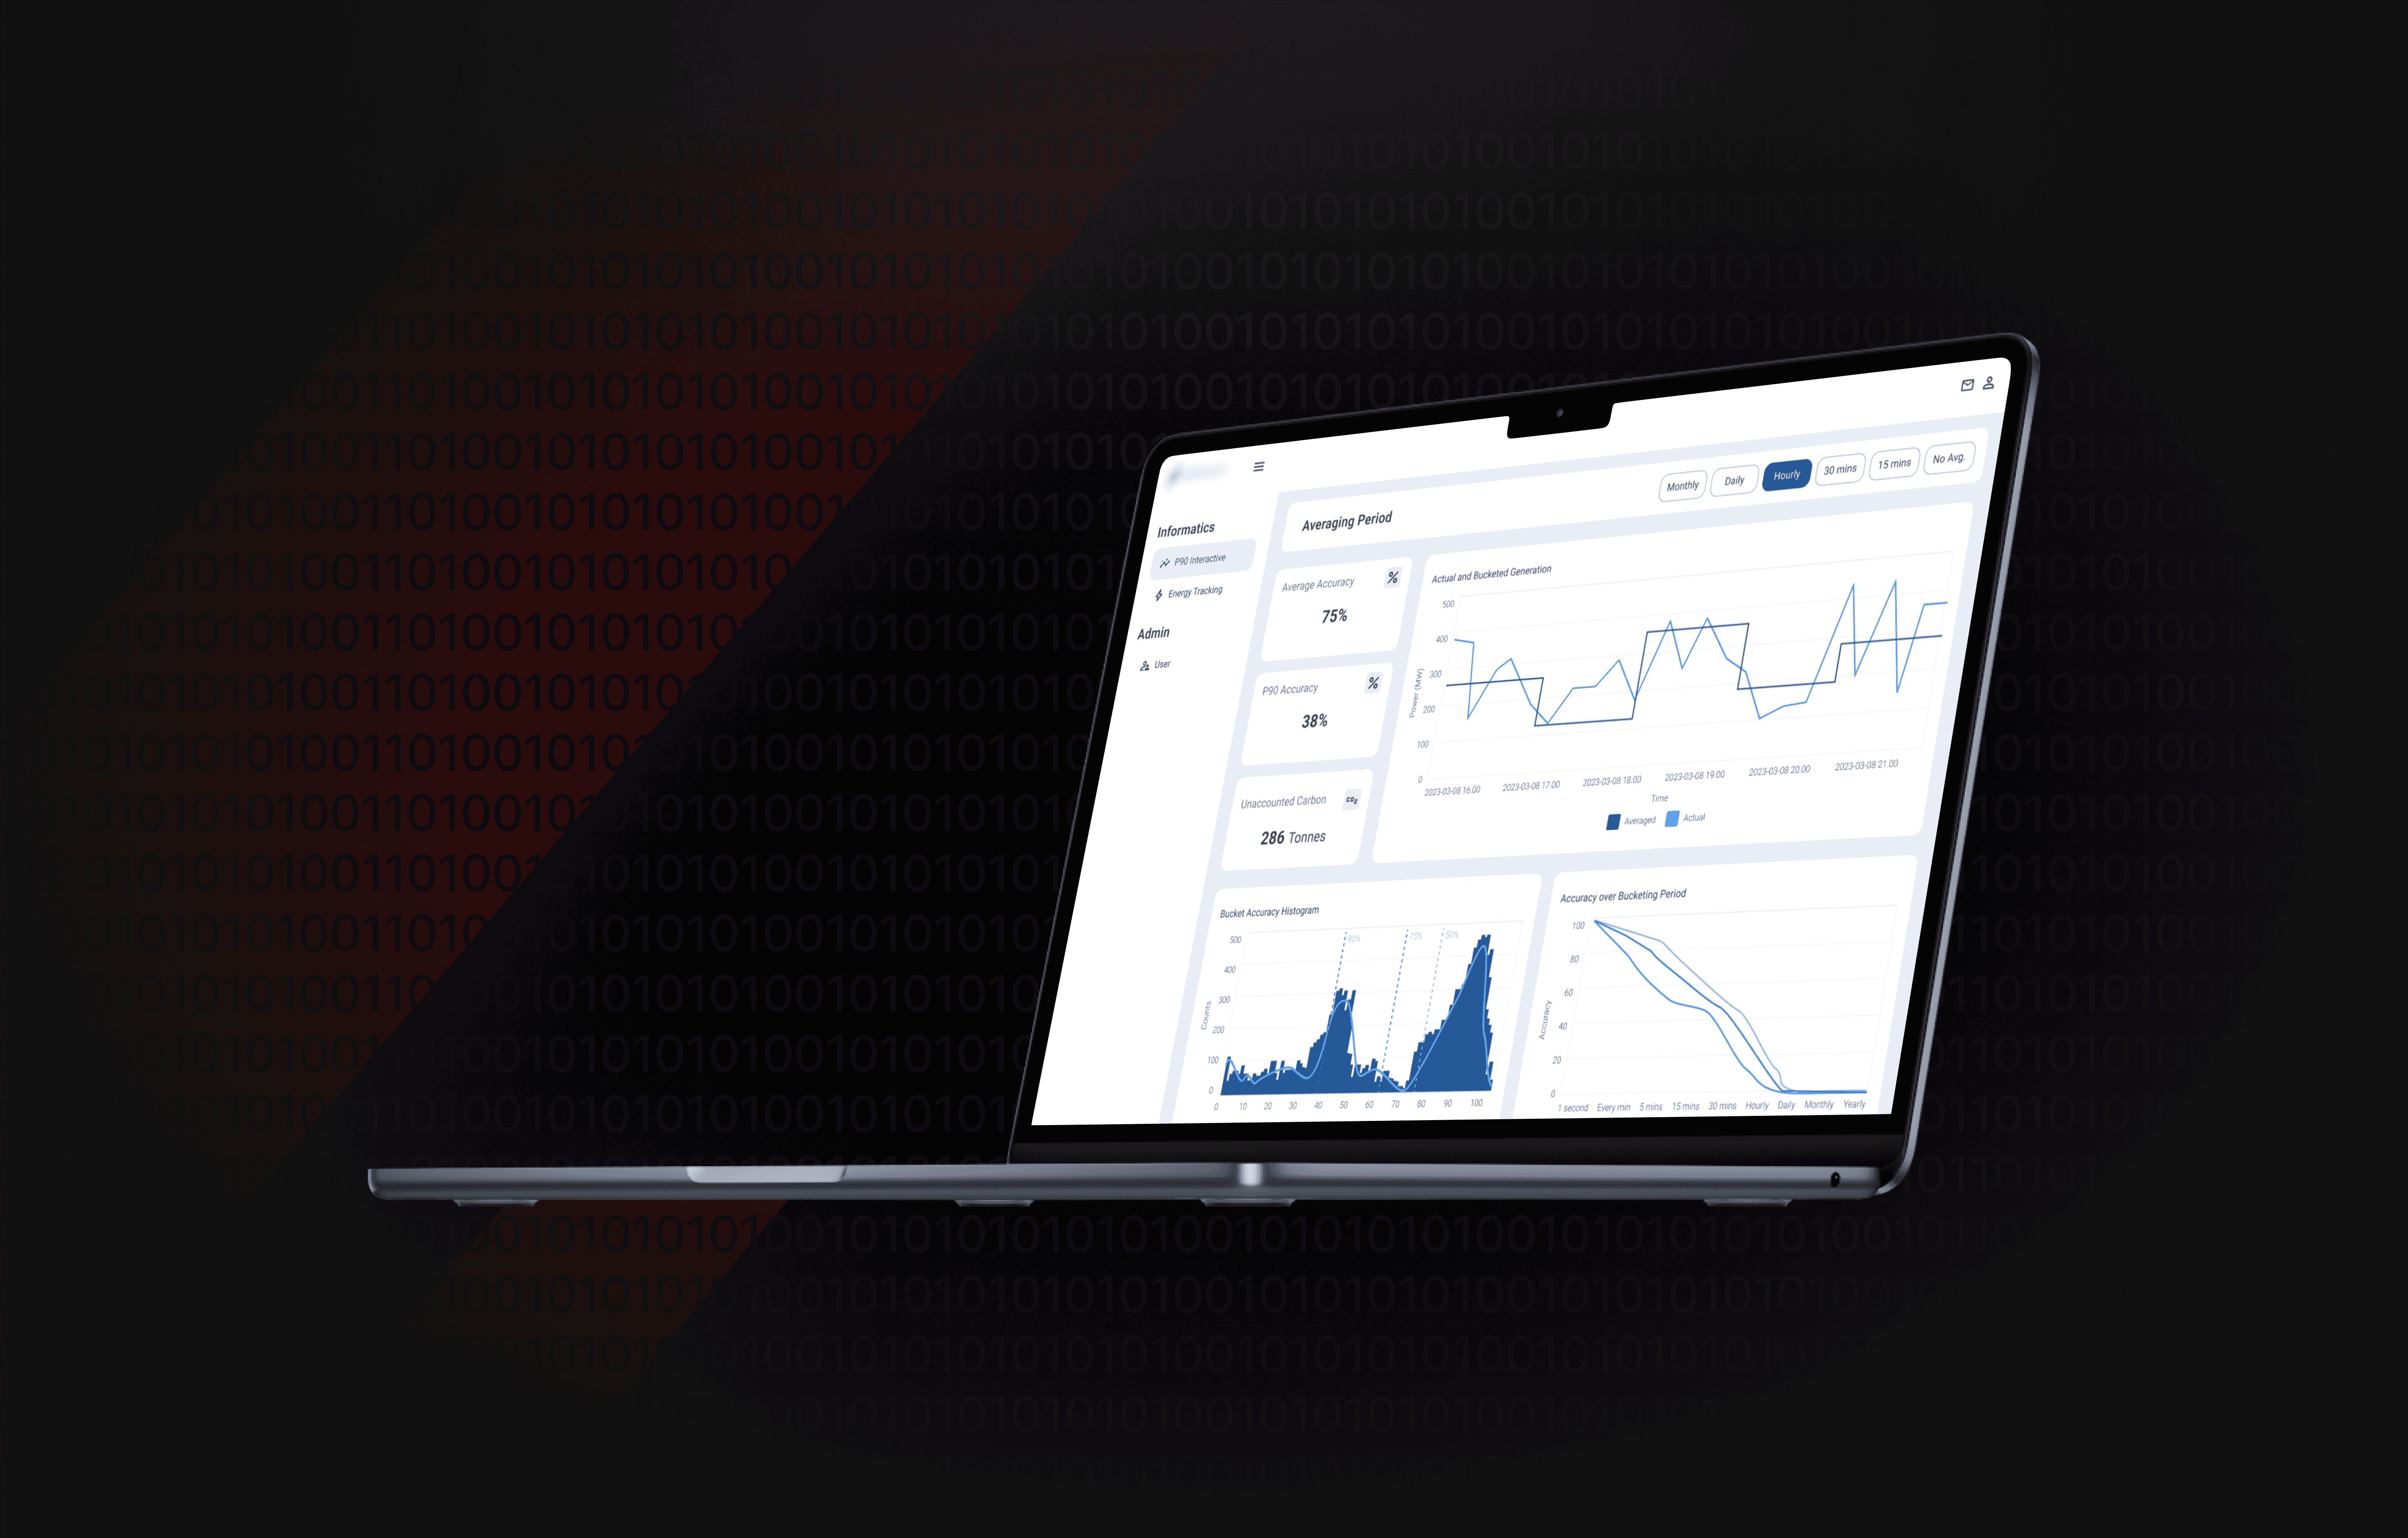
We worked side-by-side with Empati’s climate science team to translate carbon model logic into accurate and reliable visuals.
Investor-Friendly User Interface
By applying clean, intuitive design principles, we created an interface that simplifies complex environmental data for a range of users—from climate scientists to sustainability officers to venture capital partners.
—————————————————————————————————————
Impact
74% Faster Investor Reporting Turnaround
Automated dashboard reports eliminated manual formatting, allowing the team to deliver timely, data-rich updates to investors.
6× Increase in Data Points Tracked Daily
Empati AI advanced from once-daily carbon reporting to tracking over 17,000 data points per week, unlocking richer analysis and higher trust.
Cross-Team Alignment on Emissions Trends
With consistent, real-time visuals, both business and science teams operated from a shared data source—leading to faster decision cycles and clearer communication.