Marketing Performance and Workforce Analysis Dashboard
Helping TransUnion transform scattered Excel reports into an interactive analytics platform that optimizes marketing resource allocation and drives data-backed decisions.
Client
TransUnion
Timeline
2000+
Location
New York, USA
Client Overview
TransUnion is a global consumer credit reporting agency serving millions of customers across more than 30 countries. In Johannesburg, their marketing team relied on manual Excel analyses and fragmented Smartsheet trackers to measure campaign performance and manage resource assignments—an approach that struggled to keep pace with growing data volumes and evolving business needs.
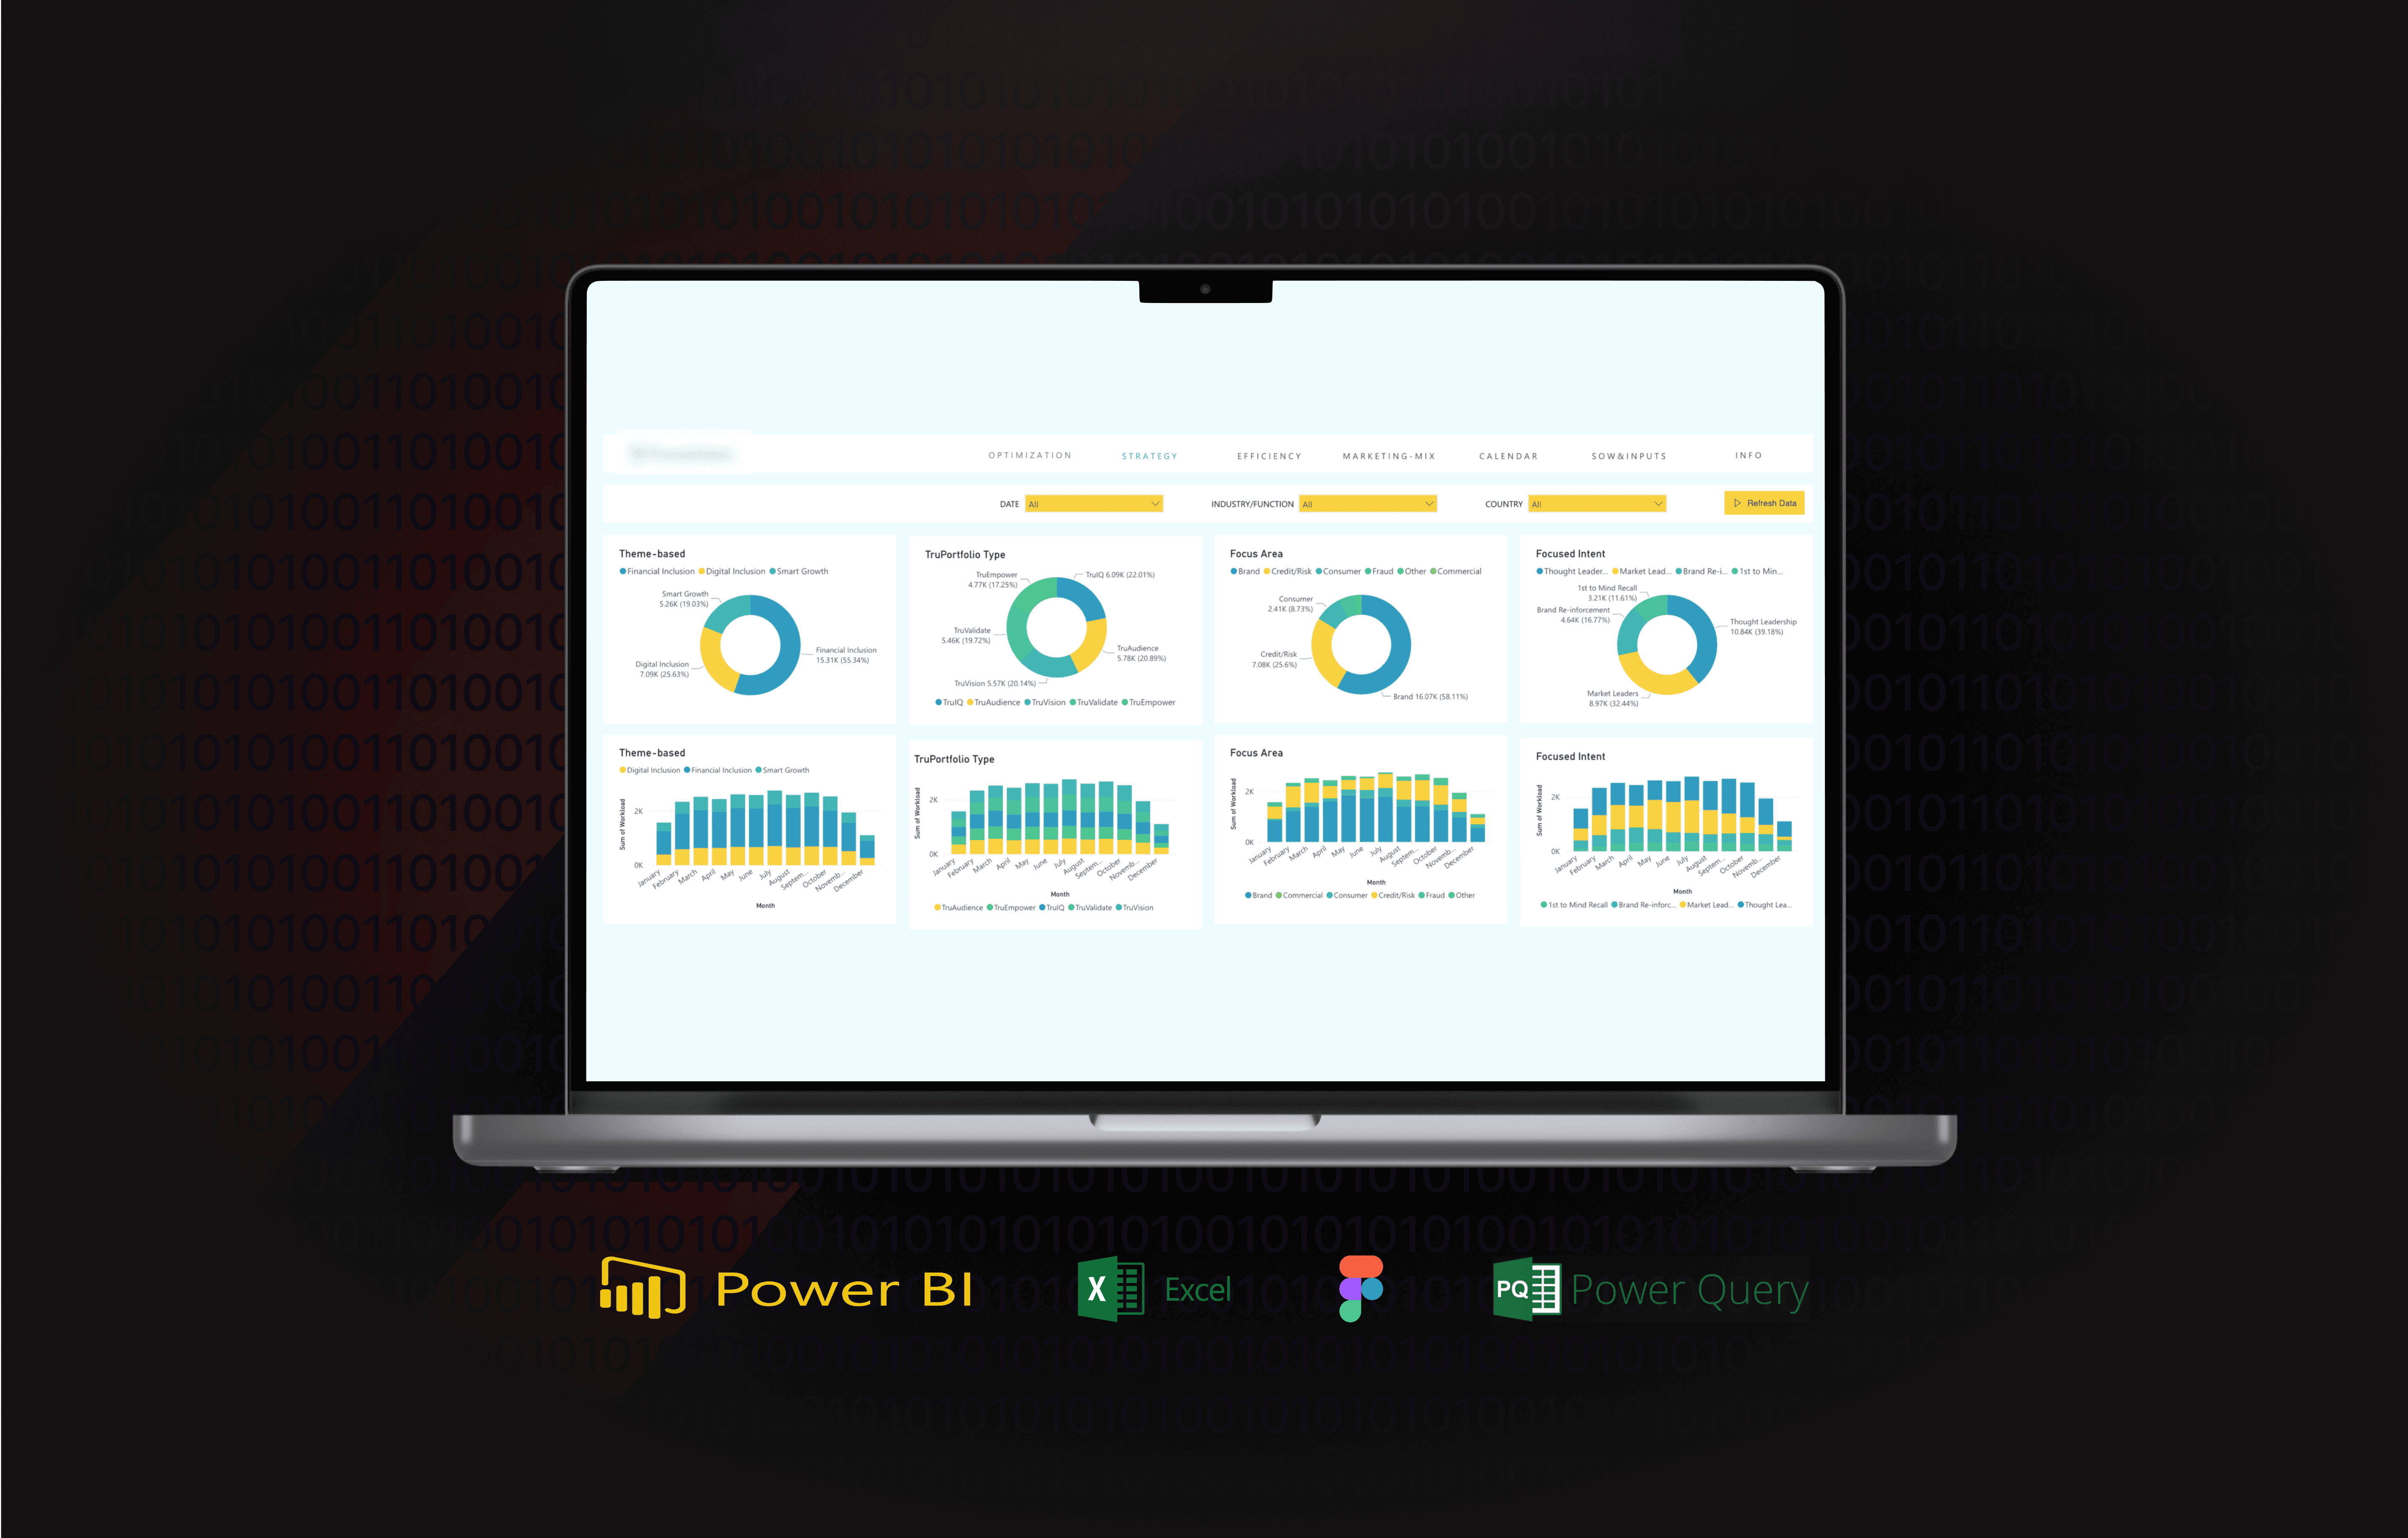
To modernize their analytics, TransUnion partnered with Vizio AI Dx Studio to replace error-prone spreadsheets with a single, automated Power BI dashboard. By integrating Smartsheet via Power Query, the new platform delivers live insights into marketing results and workforce distribution—enabling strategic decision-making in real time.
—————————————————————————————————————
Challenge
TransUnion Johannesburg’s marketing metrics were scattered across Excel files and Smartsheet lists, forcing managers to spend hours each week compiling and reconciling data. This manual process not only delayed insights but also introduced errors and version conflicts, undermining confidence in the numbers and slowing down critical funding and staffing decisions.
—————————————————————————————————————
Objective
Build a unified, interactive dashboard that automates data ingestion from Smartsheet and Excel, enforces a single source of truth, and empowers marketing leaders to allocate resources and adjust campaigns on the fly.
—————————————————————————————————————
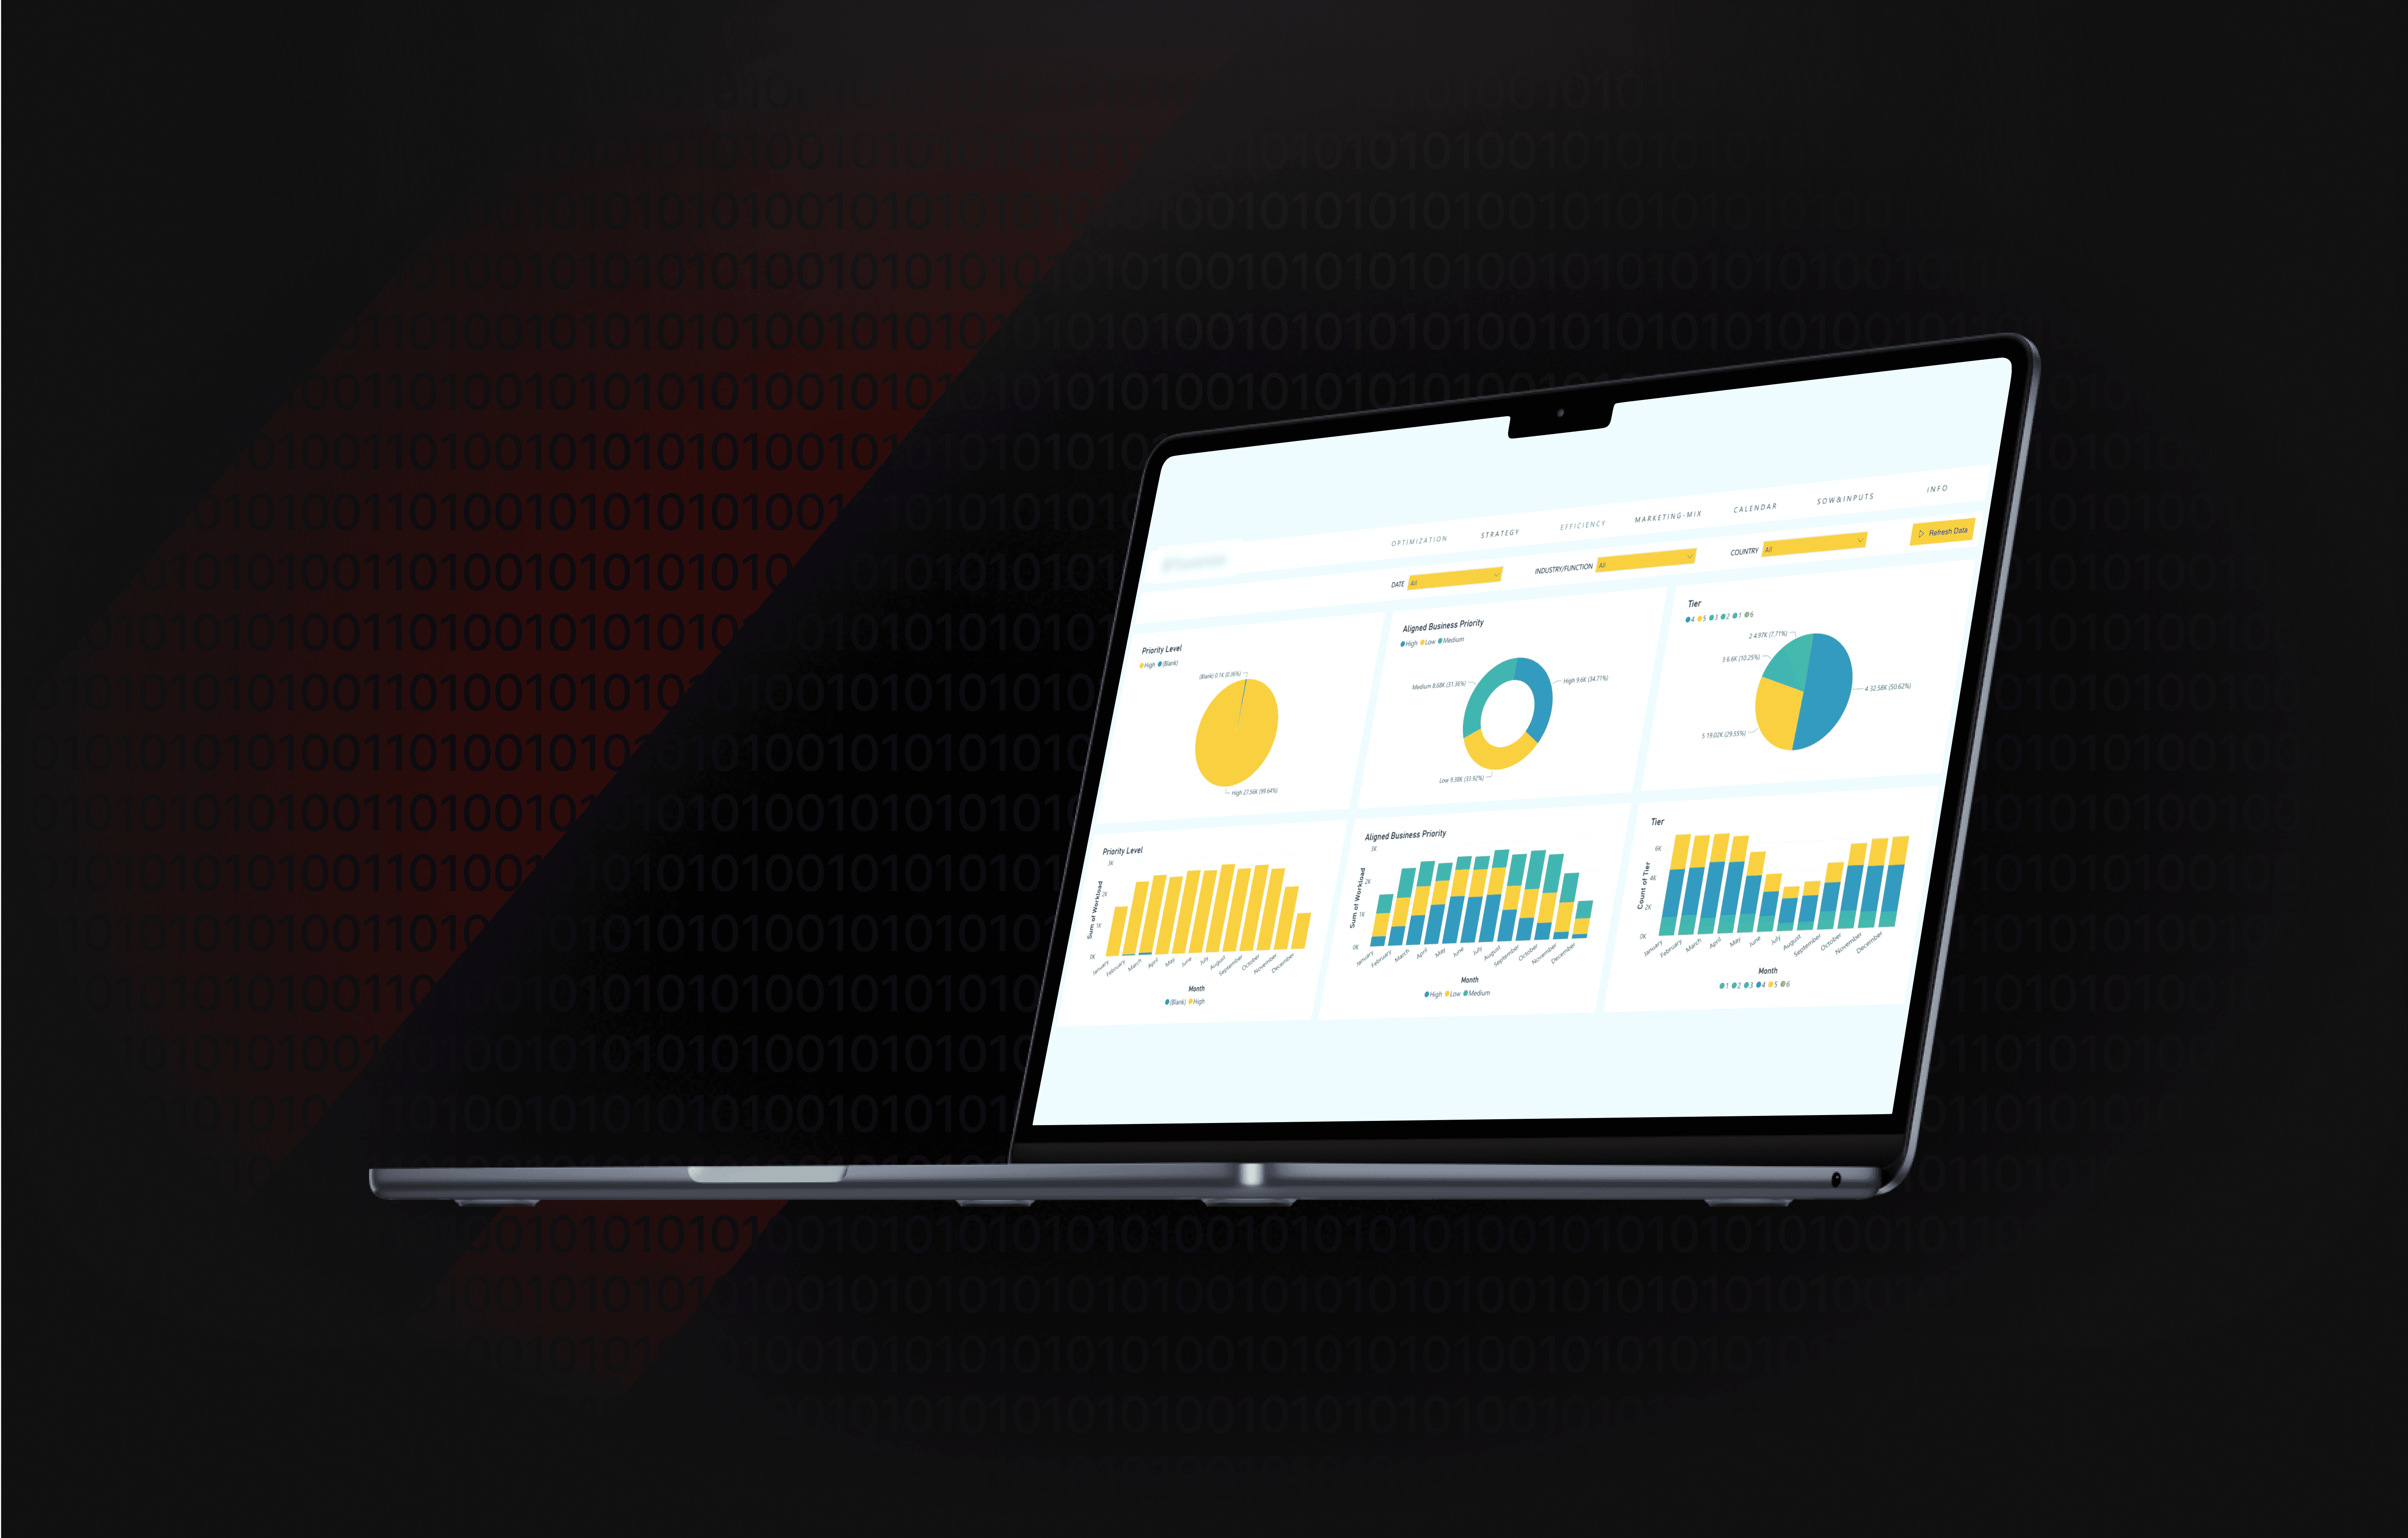
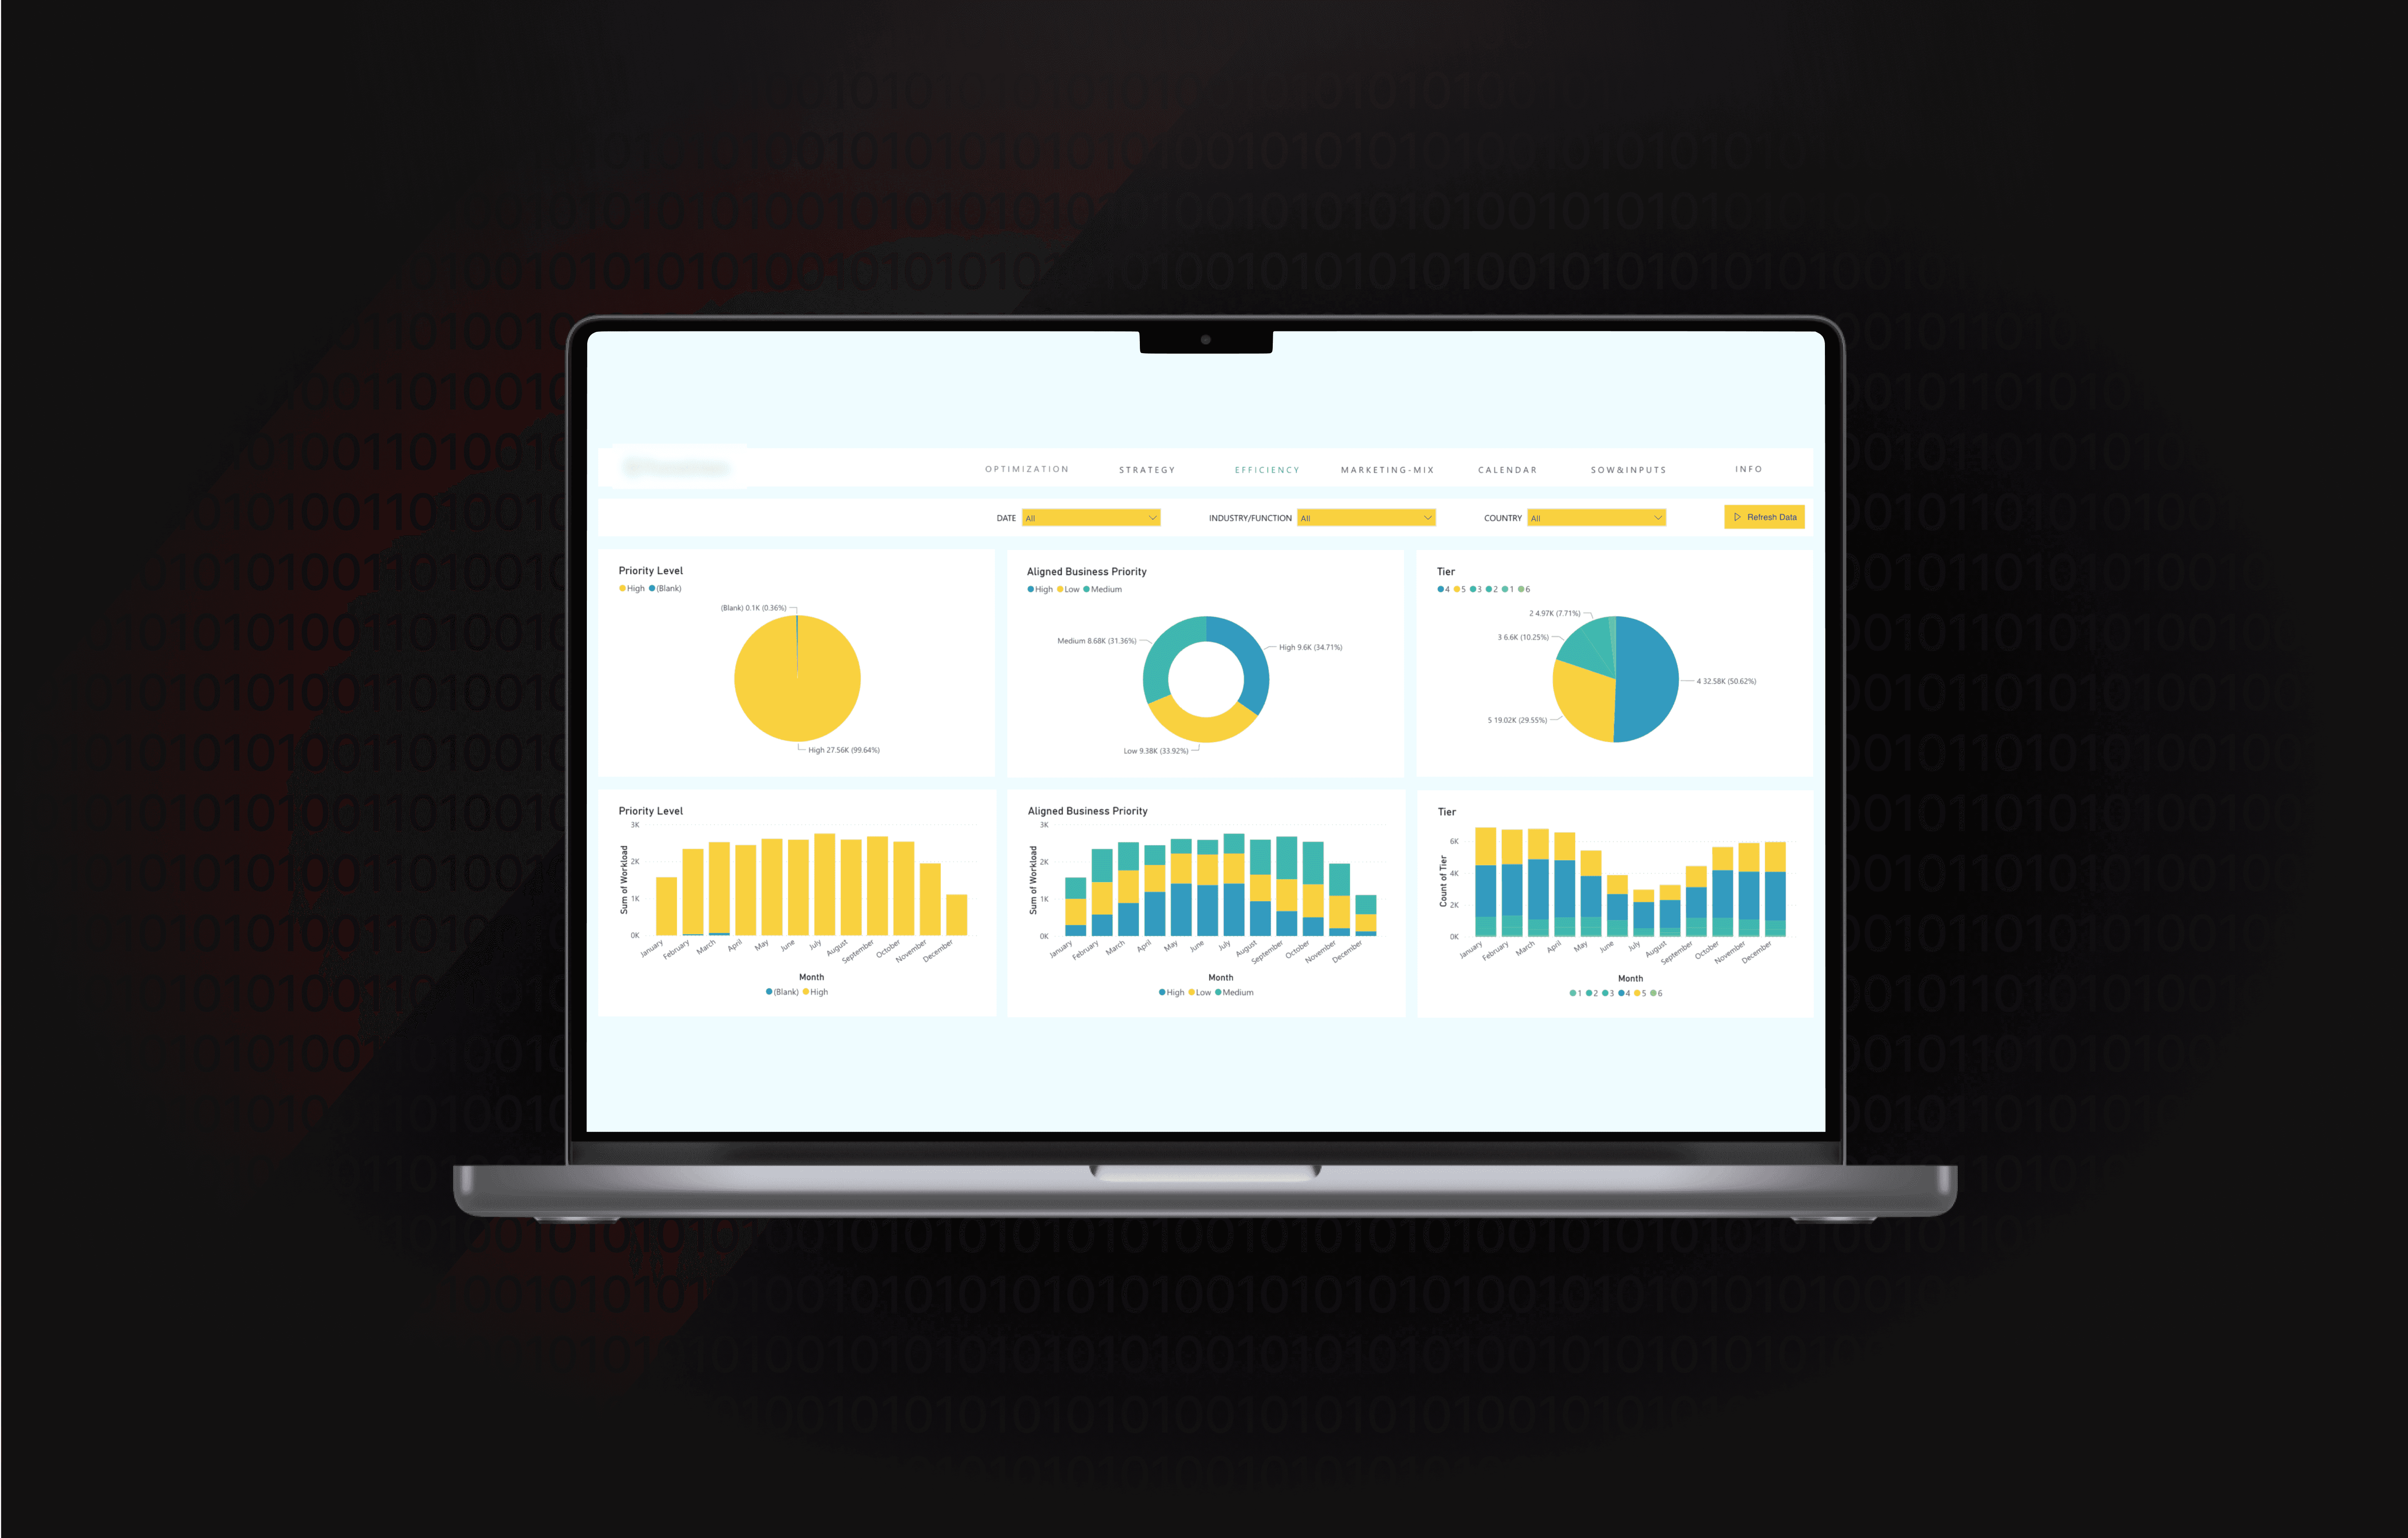
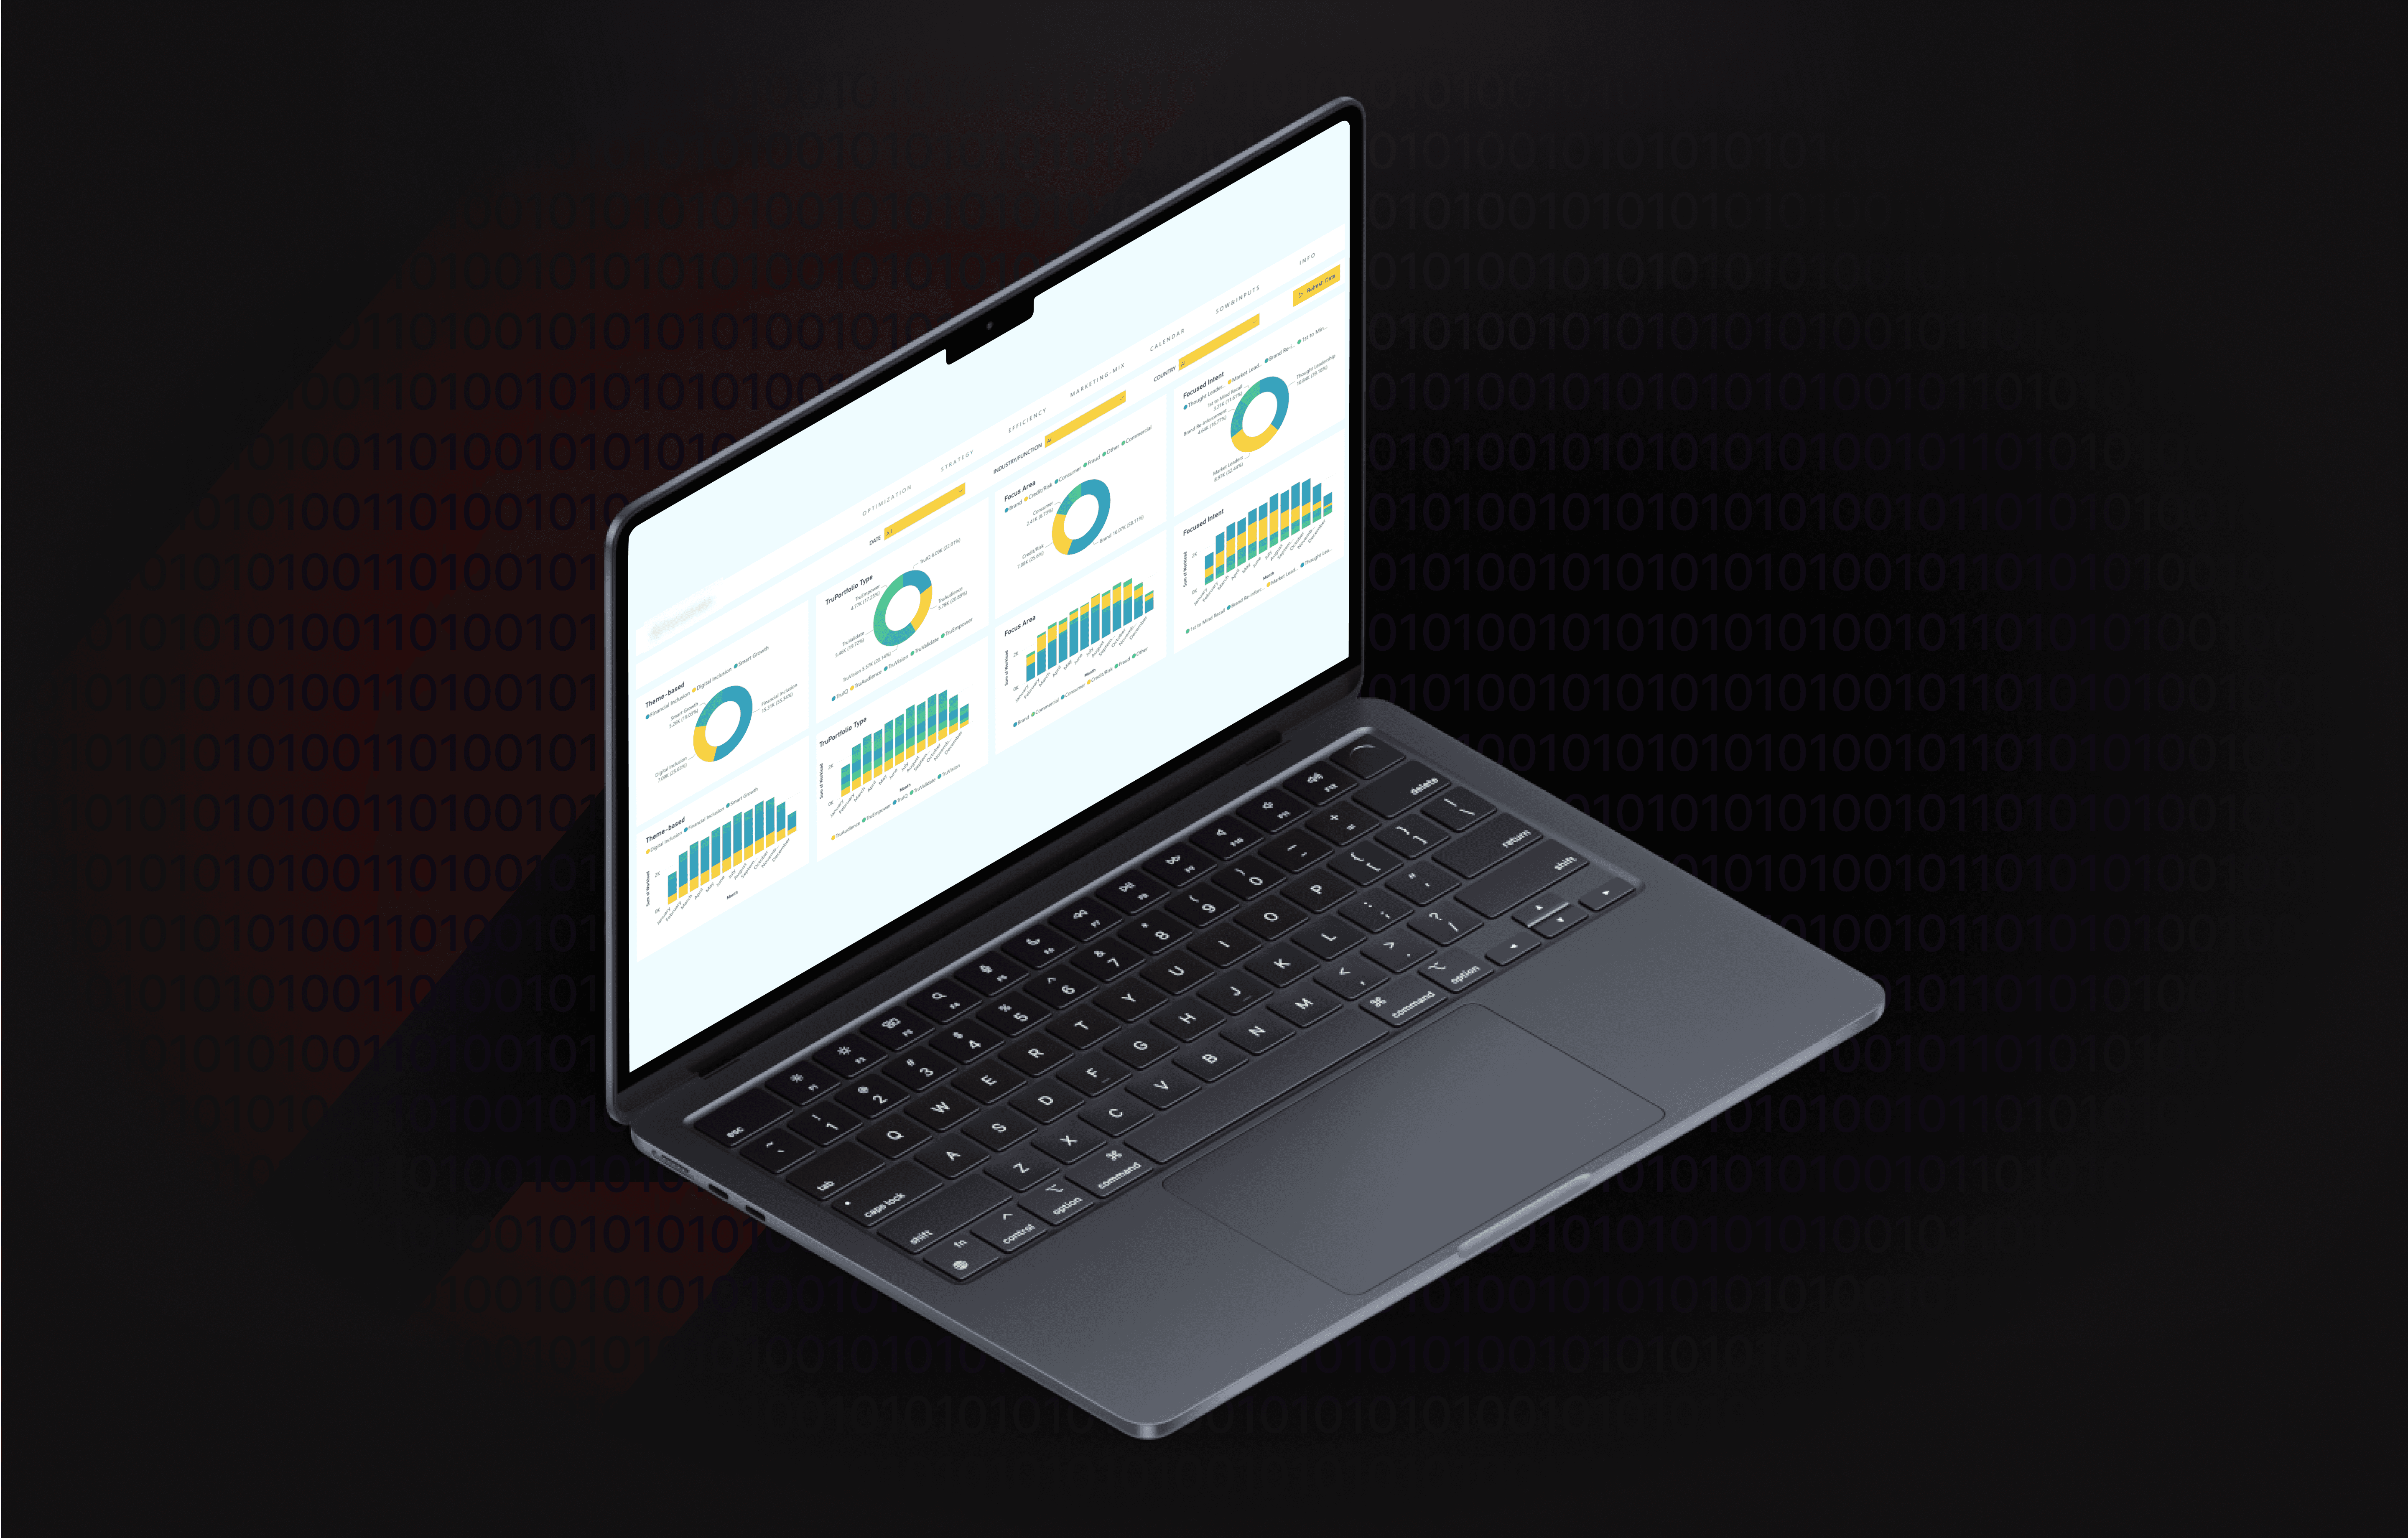
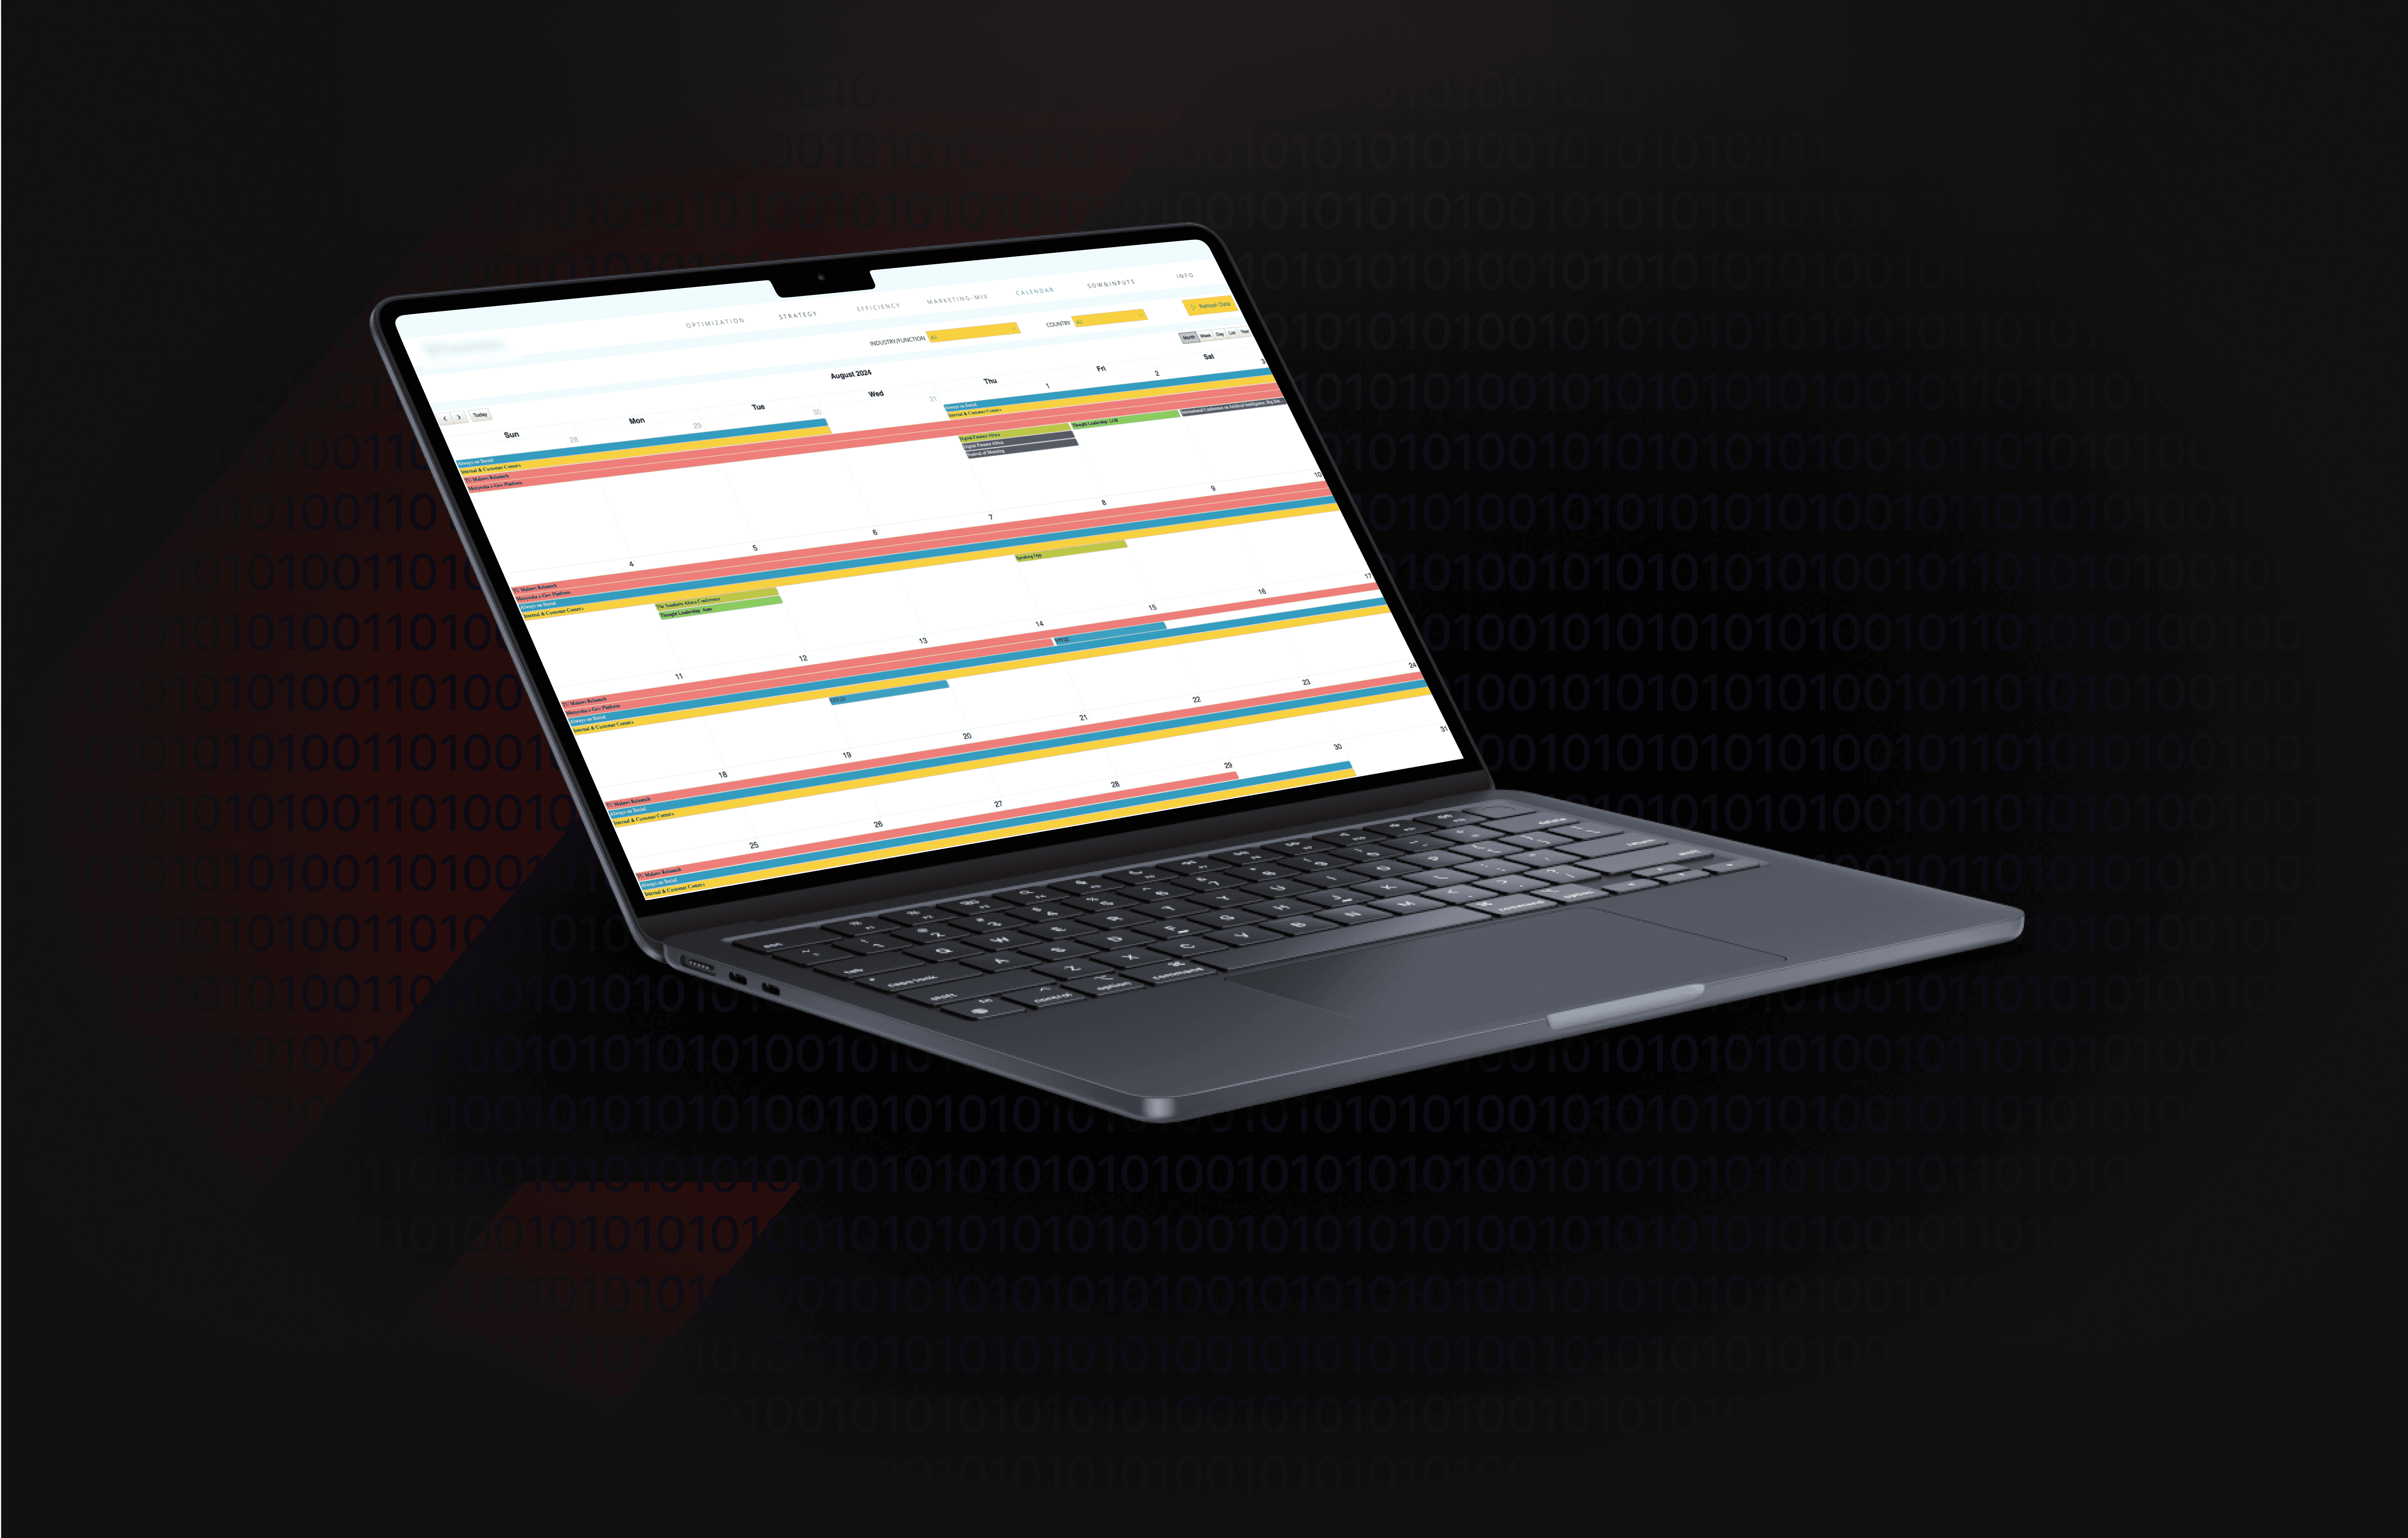
Solution
Automated Data Pipeline
Implemented a Power Query–driven ETL process to extract, transform, and load Smartsheet and Excel data into Power BI—eliminating manual imports and ensuring data consistency.
Custom Power BI Interface
Designed an interactive dashboard featuring live campaign metrics, workforce distribution charts, and drill-down filters by channel, region, and timeframe for on-demand analysis.
Consolidated Data Migration
Migrated historical Excel reports into Smartsheet first, then linked the unified dataset into Power BI—cutting out duplicate worksheets and guaranteeing accuracy.
Dynamic Reporting & Exports
Enabled one-click report exports and presentation-ready visuals, freeing the team to focus meetings on strategy rather than data wrangling.
—————————————————————————————————————
Impact
$60K Annual Cost Savings
Automating data workflows and reporting eliminated over 1,500 manual hours per year—equating to $60,000 saved in staffing and contractor costs.
35% Increase in Campaign ROI
Real-time performance insights allowed tighter budget control and rapid A/B testing, boosting return on ad spend by 35%.
48-Hour Faster Reporting Cycle
End-to-end automation shrank the monthly reporting cycle from five days to under two—delivering critical insights nearly 48 hours sooner.
—————————————————————————————————————