Digital Marketing Analytics Dashboard
Helping Taktical Digital simplify and scale client reporting by unifying marketing performance data into a single, real-time analytics platform.
Client
Taktical Digital
Timeline
50-200
Location
New York, USA
Client Overview
Taktical Digital is a performance-driven marketing agency that supports high-growth brands through paid media, SEO, and content strategies. As their client roster grew, so did the complexity of campaign reporting. Disparate dashboards, manual updates, and inconsistent visualizations created confusion—both internally and for clients.
To elevate their client experience and reporting operations, Taktical partnered with Vizio AI to create a streamlined, real-time marketing analytics portal tailored to the needs of both account managers and clients.
—————————————————————————————————————
Challenge
Clients were receiving campaign reports from multiple platforms—Google, Meta, LinkedIn—each with different metrics, formats, and update schedules. This fragmentation hindered clarity and slowed decision-making. Account managers spent significant time manually assembling reports, while clients struggled to interpret performance across channels.
Taktical needed a single, consolidated solution that made reporting effortless, accurate, and accessible.
—————————————————————————————————————
Objective
Design and implement a centralized dashboard system that merges marketing performance data across platforms, allowing Taktical to deliver consistent, real-time reporting that clients could understand and act on—without jumping between tools.
—————————————————————————————————————
Solution
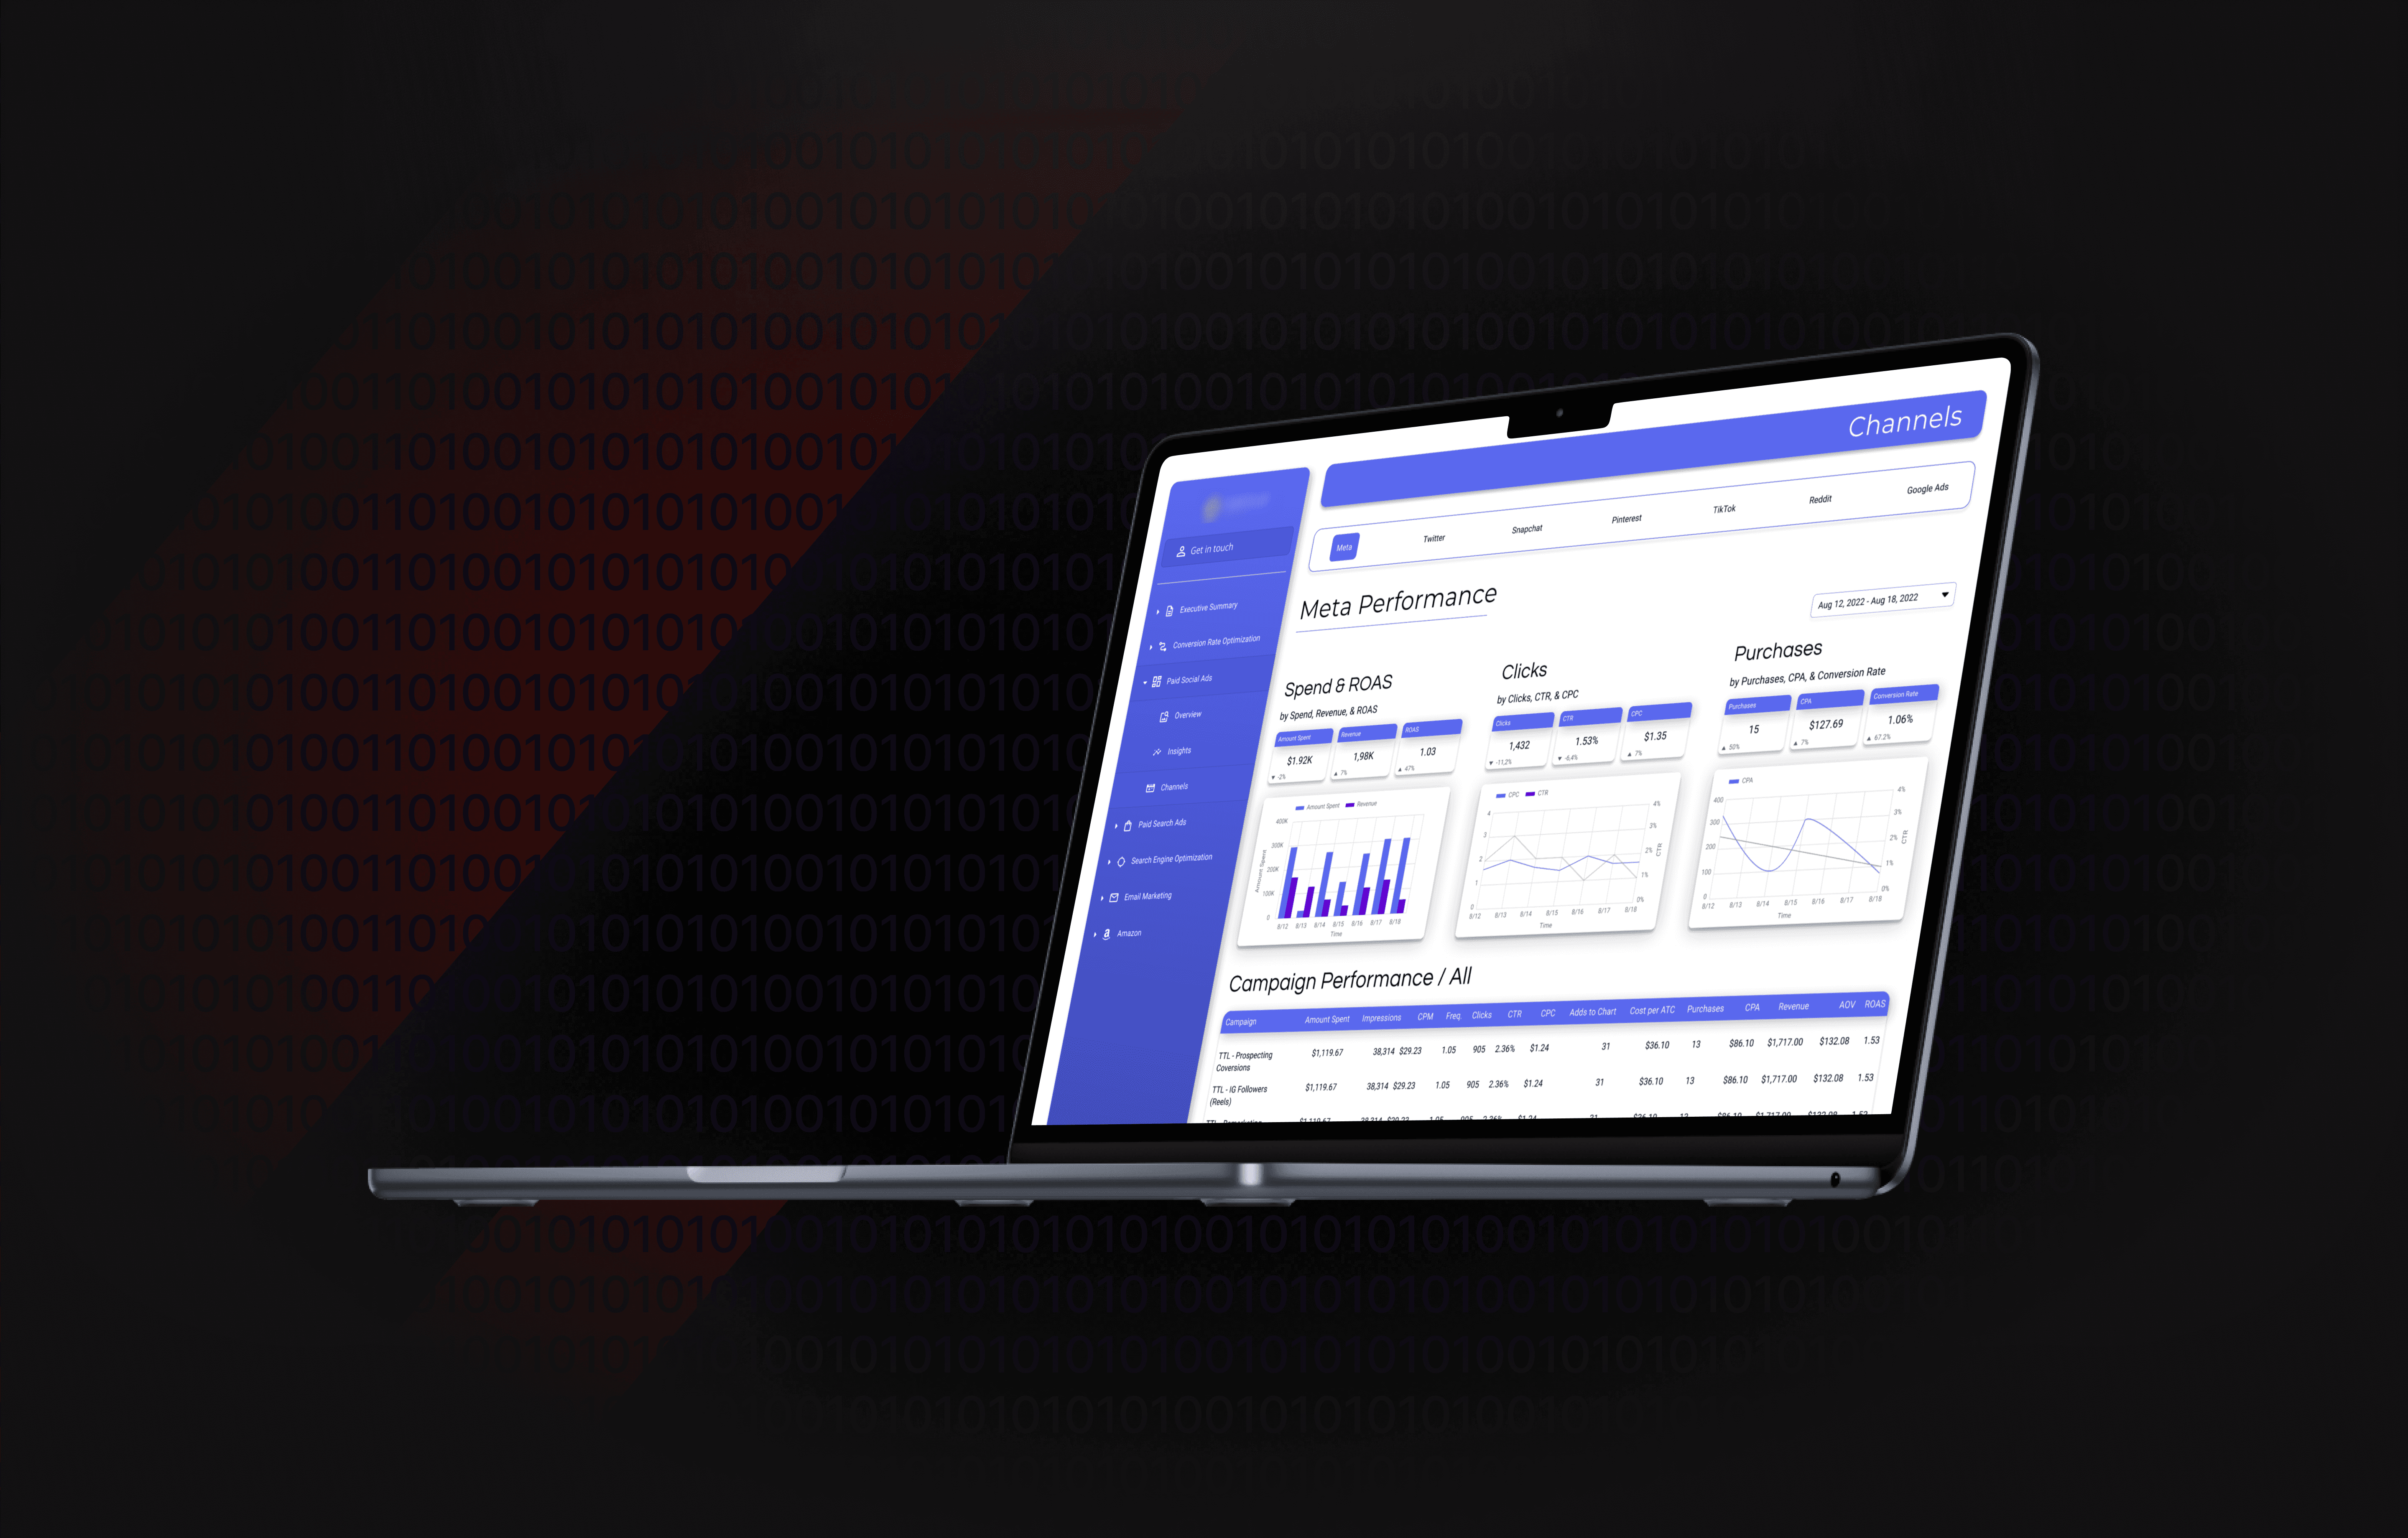
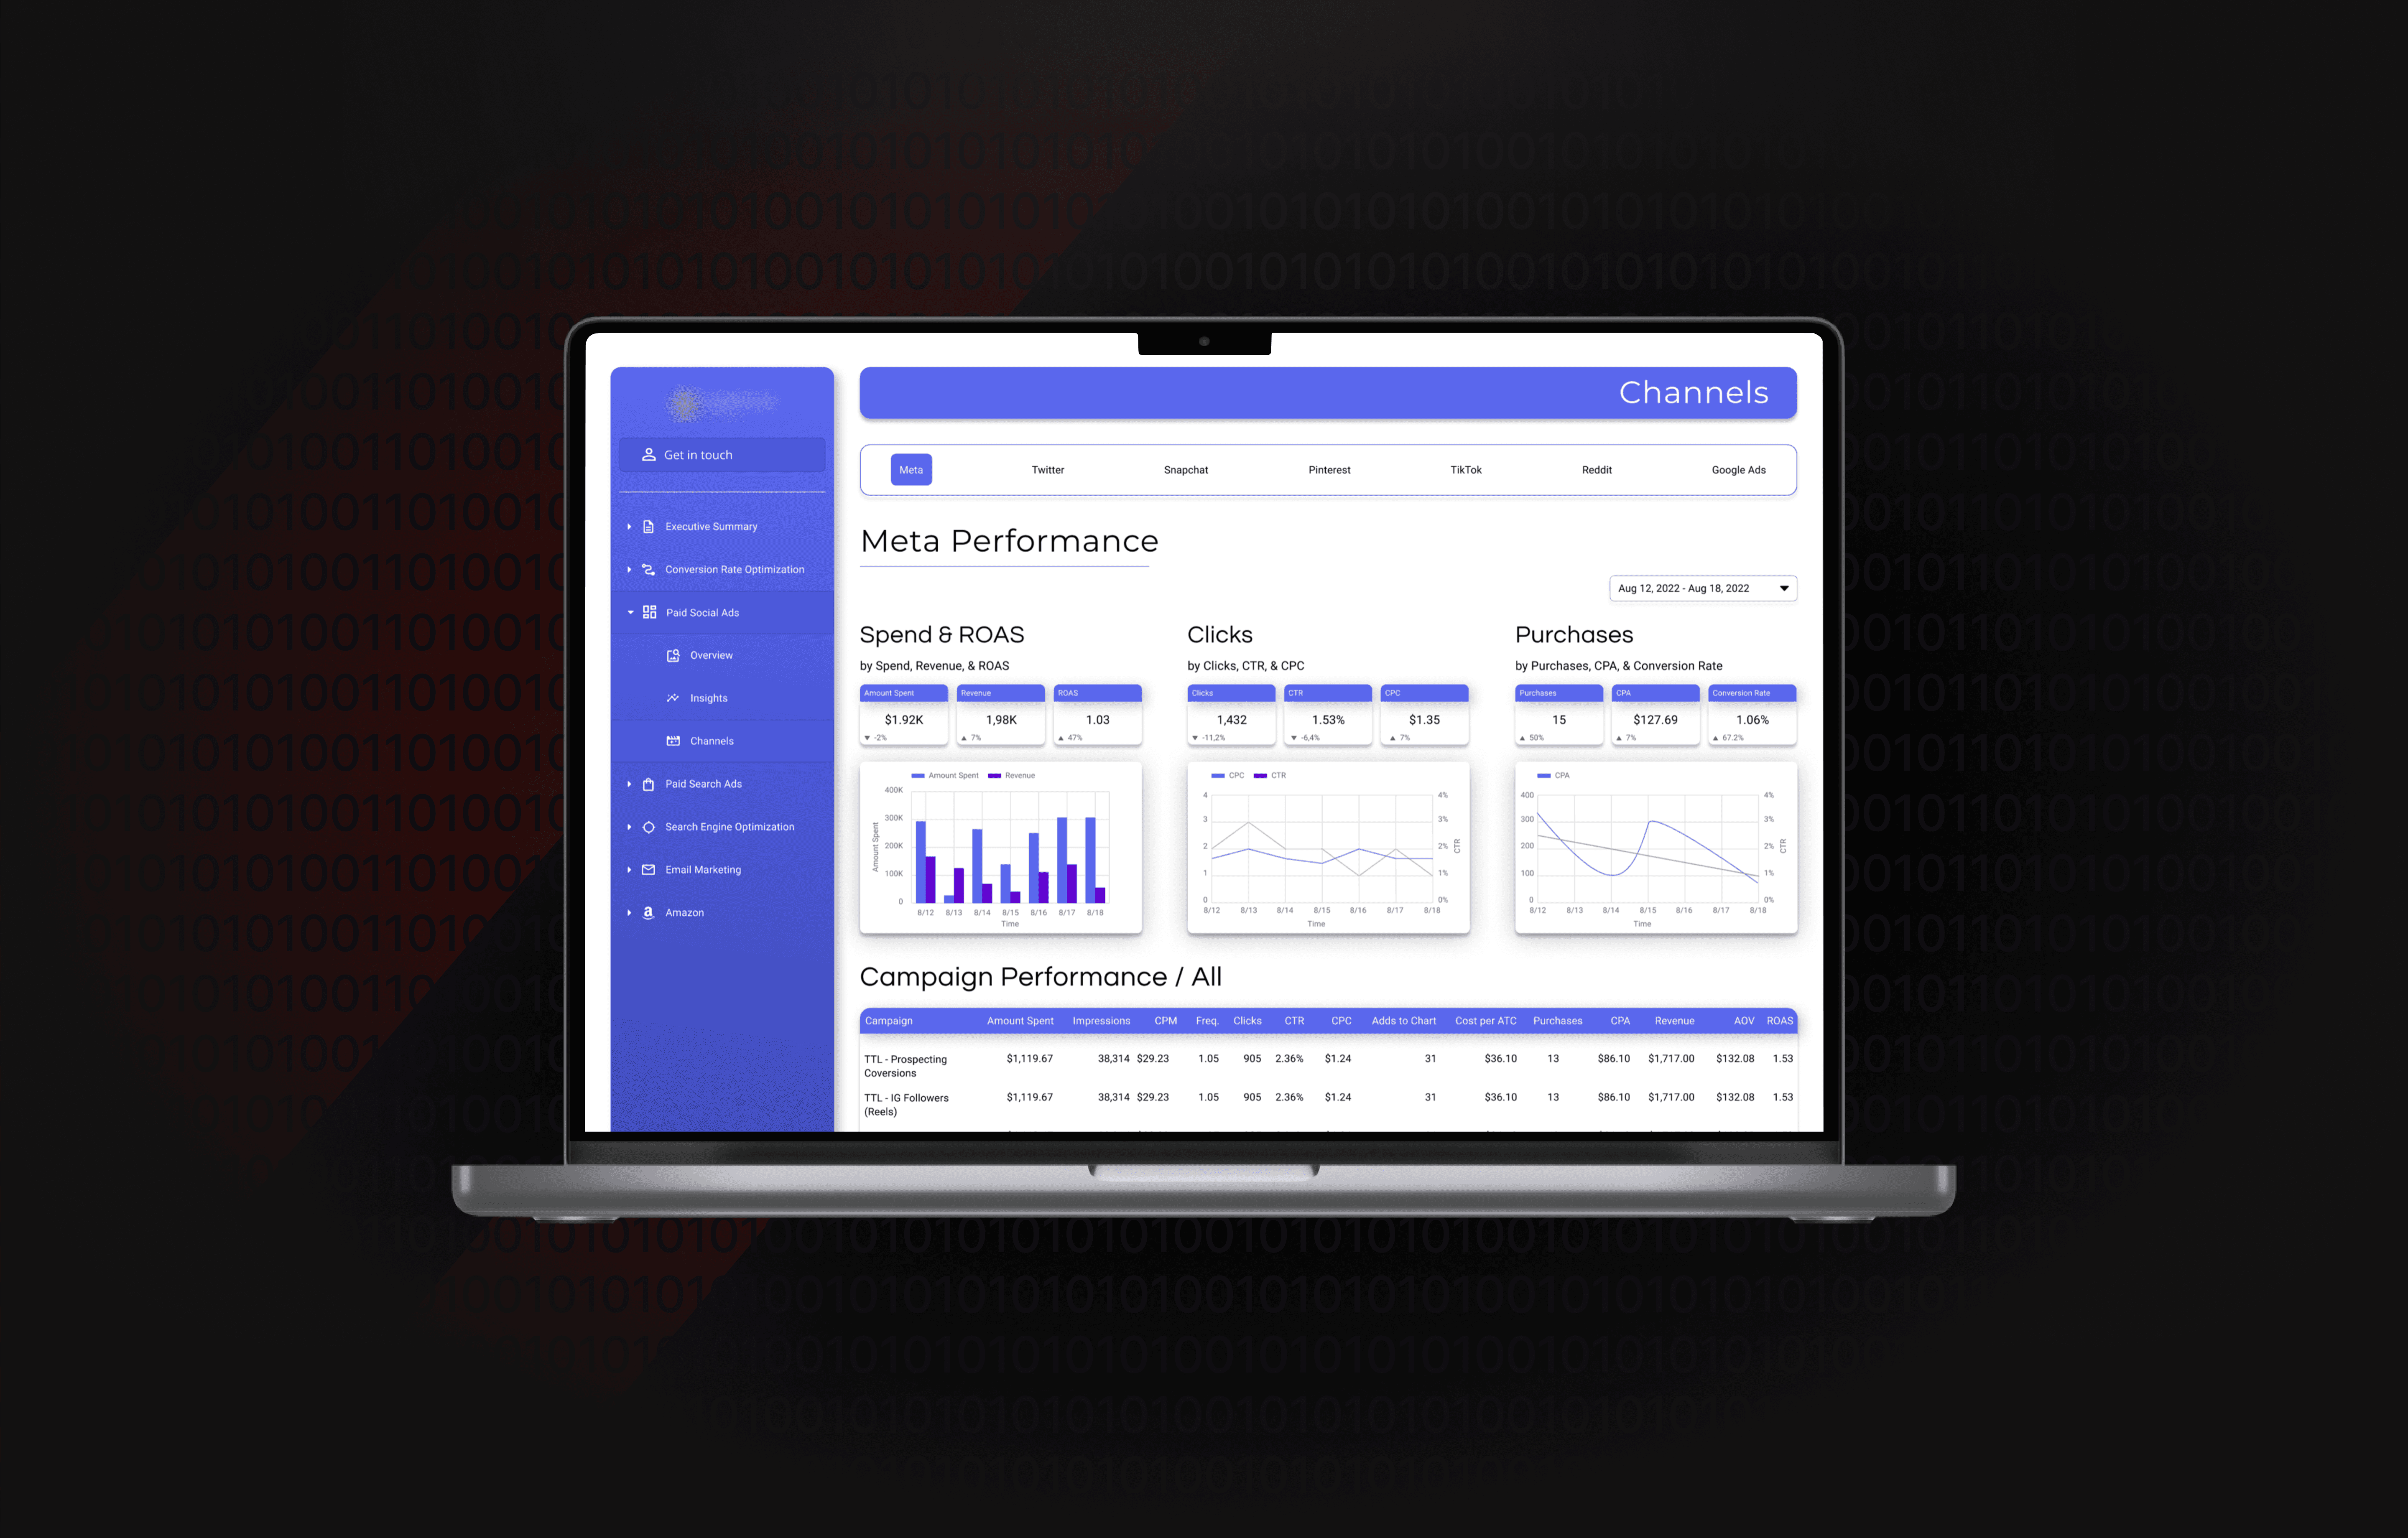
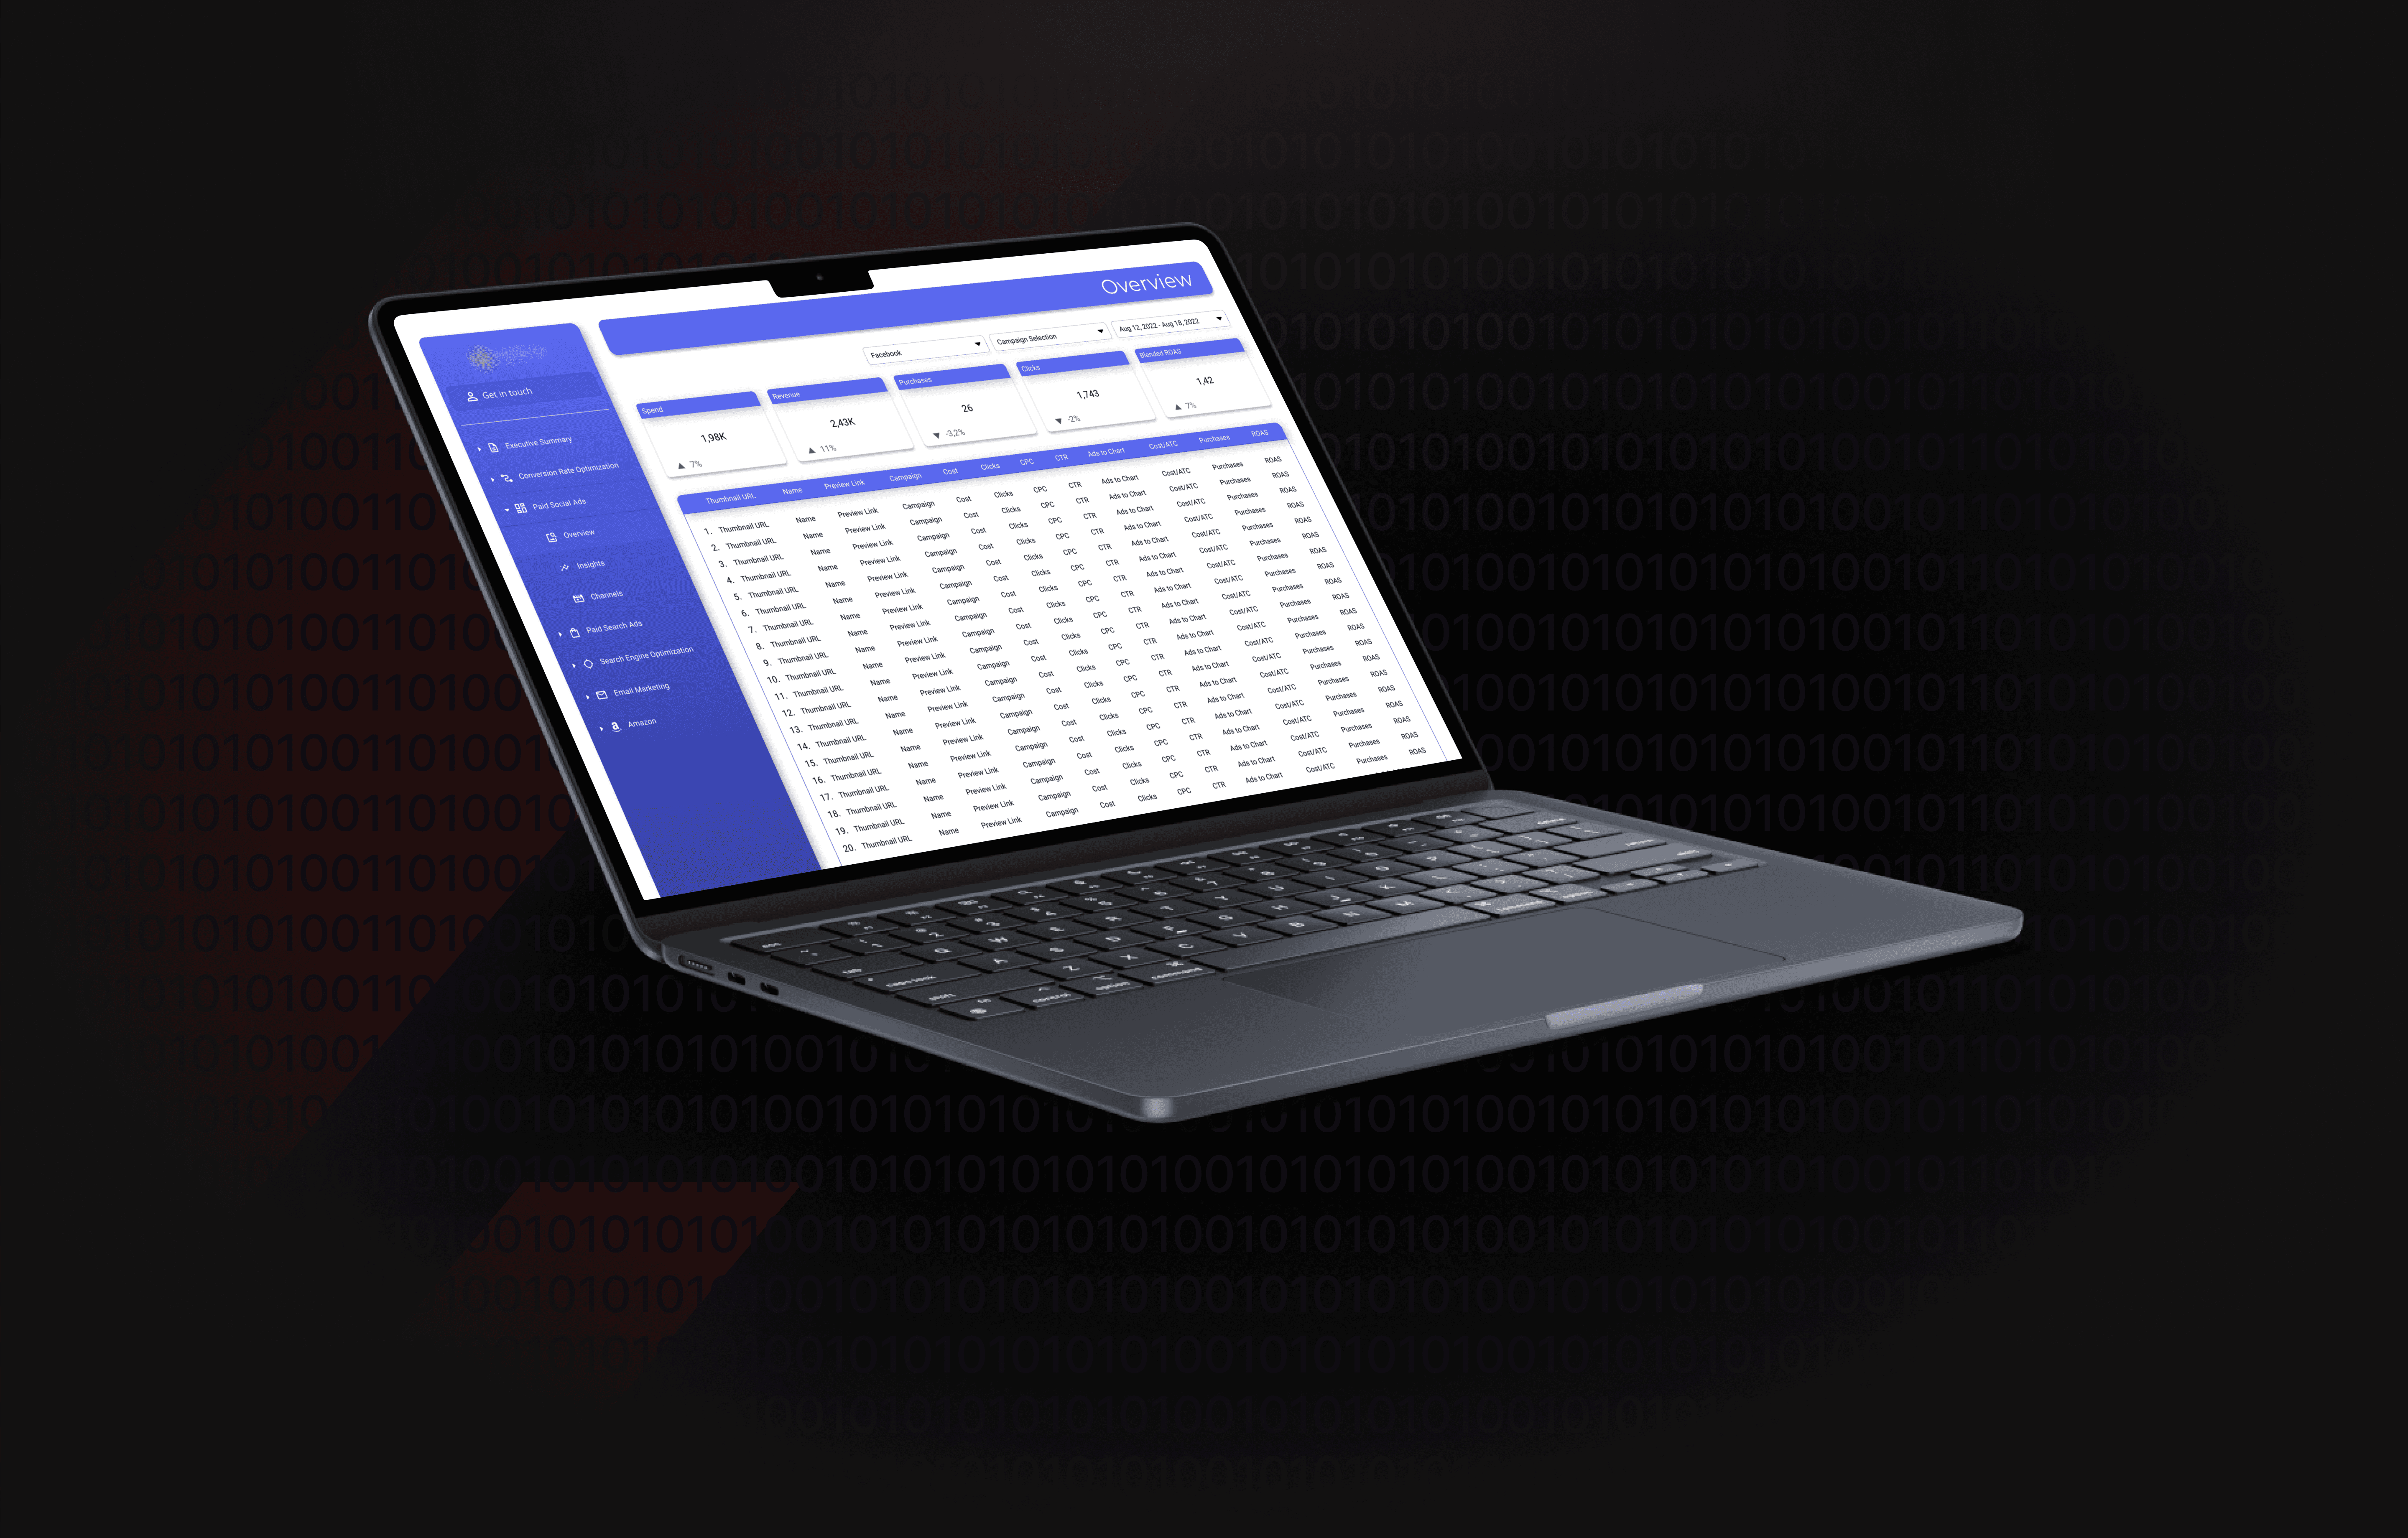
Centralized Looker Studio Portal
We built a branded reporting hub using Looker Studio, integrating all active ad accounts into one intuitive platform—reducing confusion and presenting a unified view of performance.
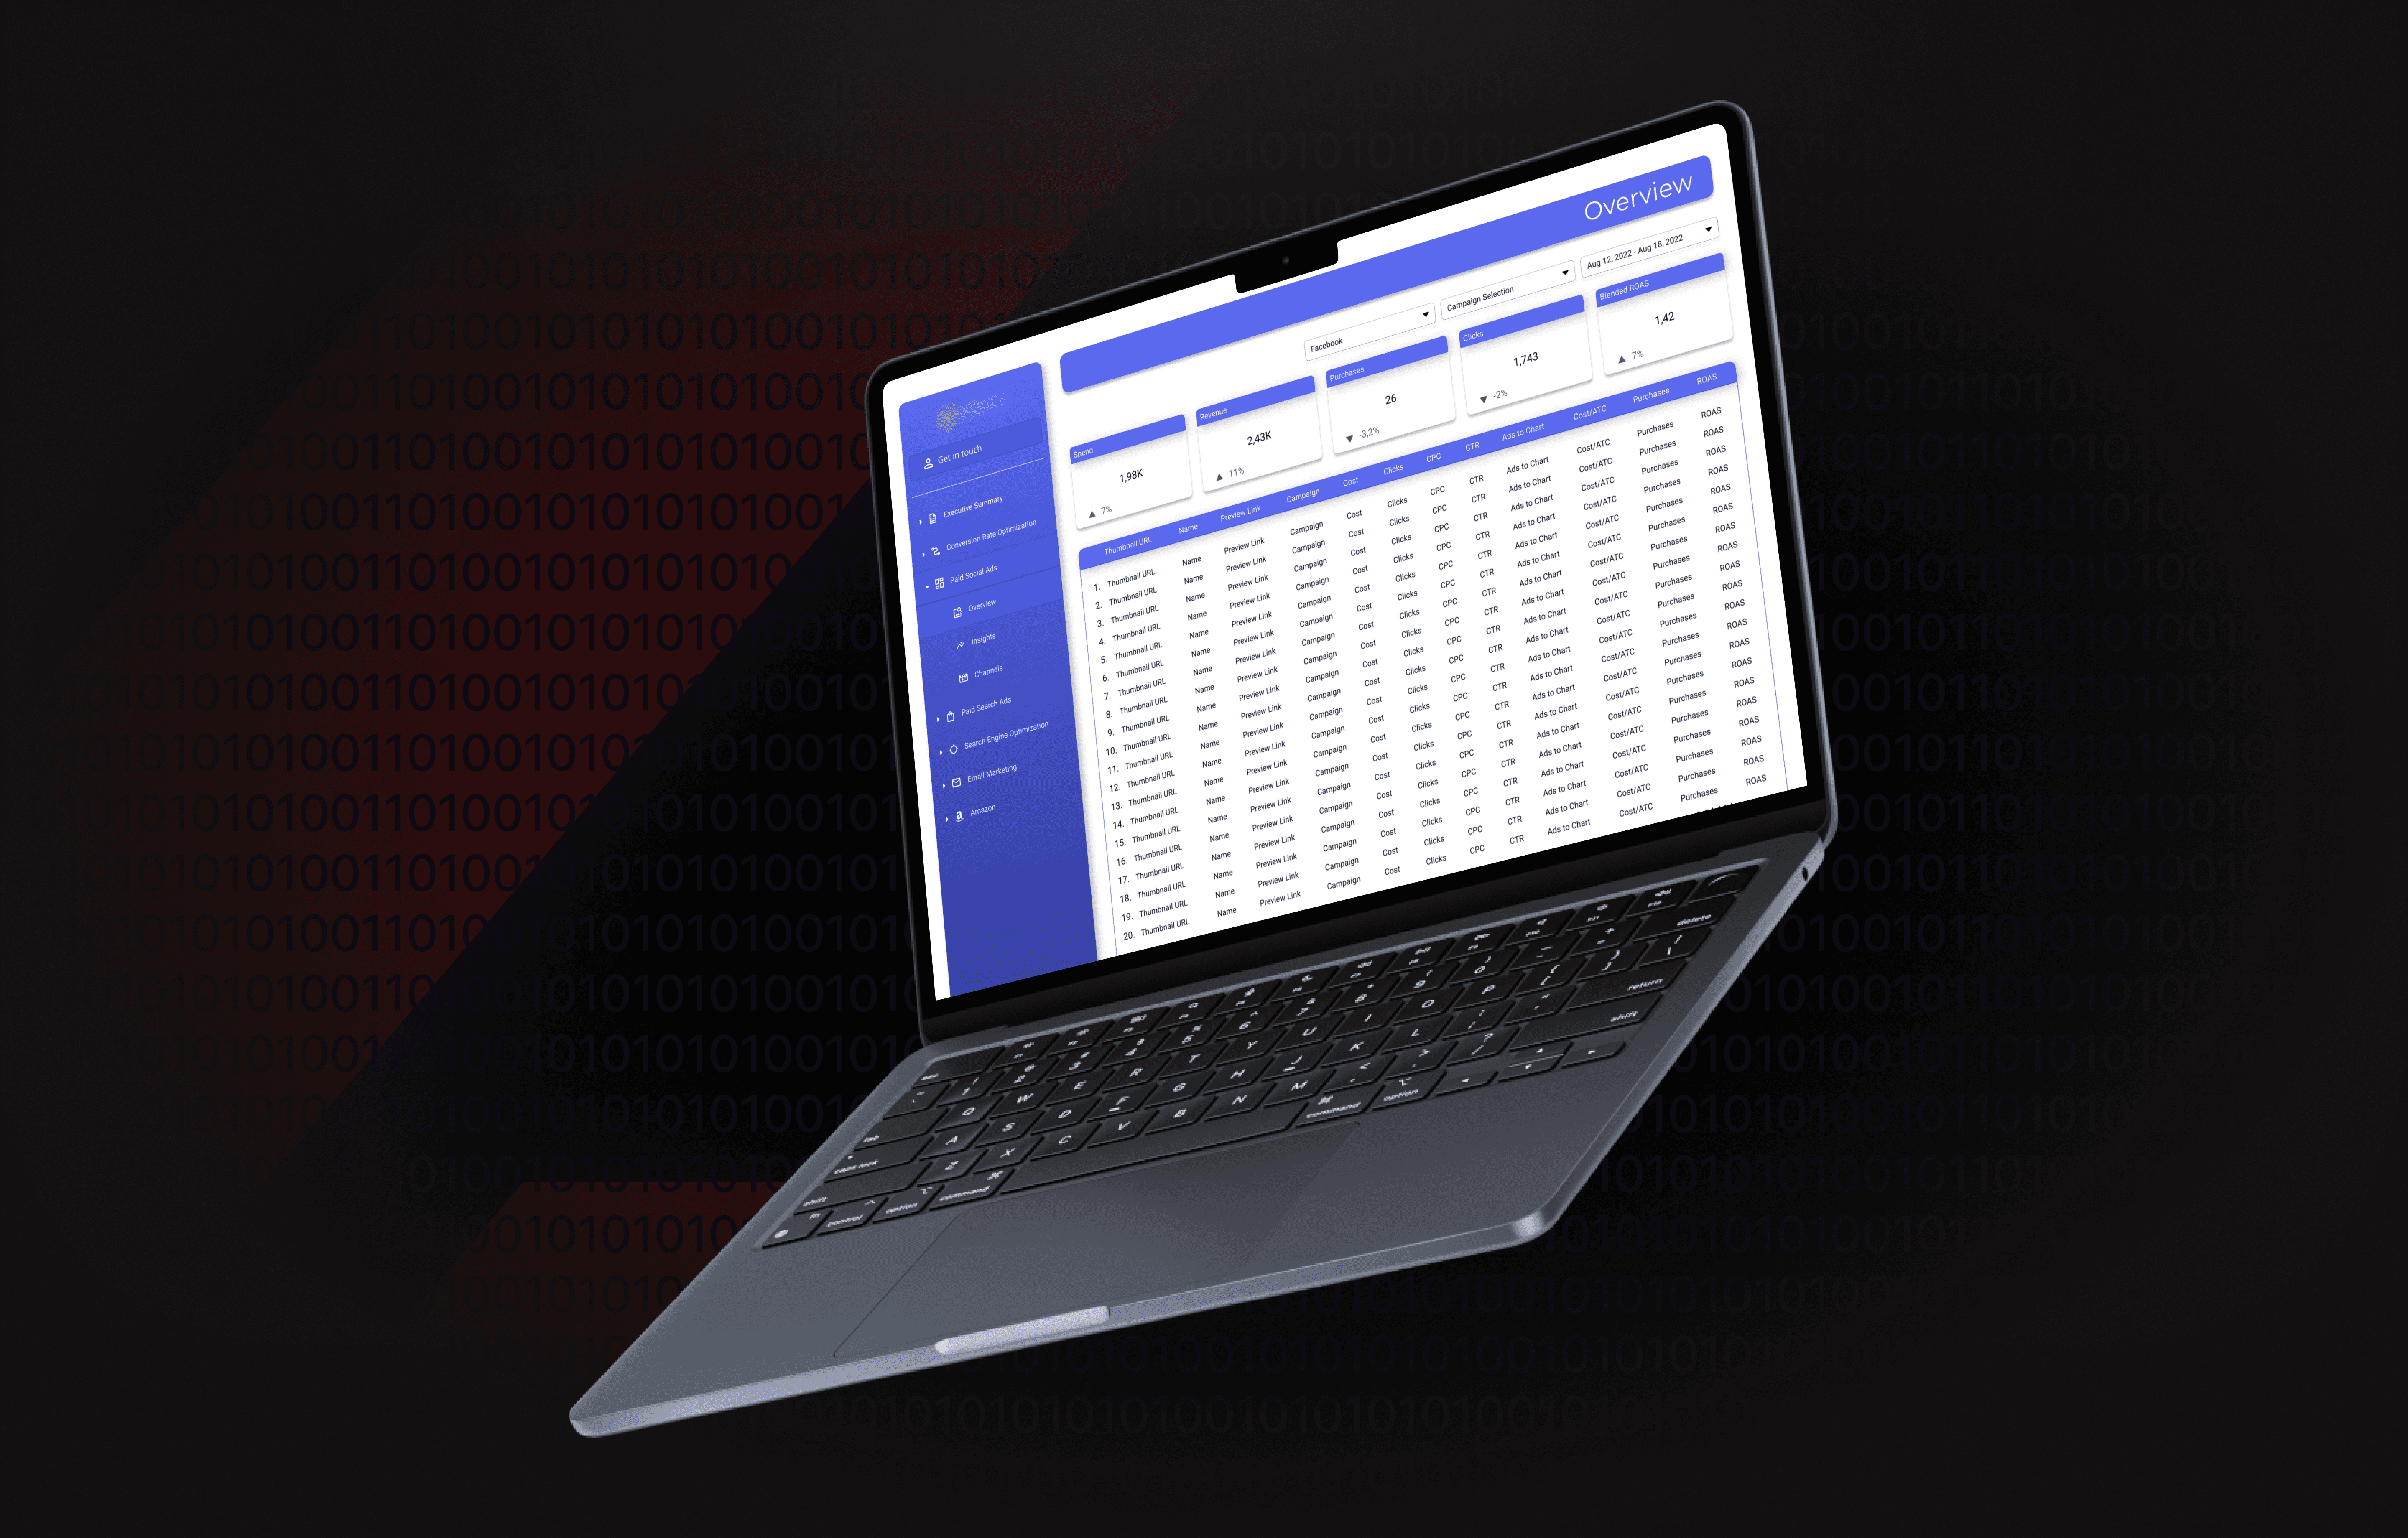
Real-Time, Filterable Dashboards
Custom dashboards provided both high-level summaries and granular insights. Clients could filter by date, channel, or campaign to explore what matters most to them.
Simplified Visual Language
We translated raw campaign data into clean, digestible visualizations—ensuring marketing managers and founders alike could understand results at a glance.
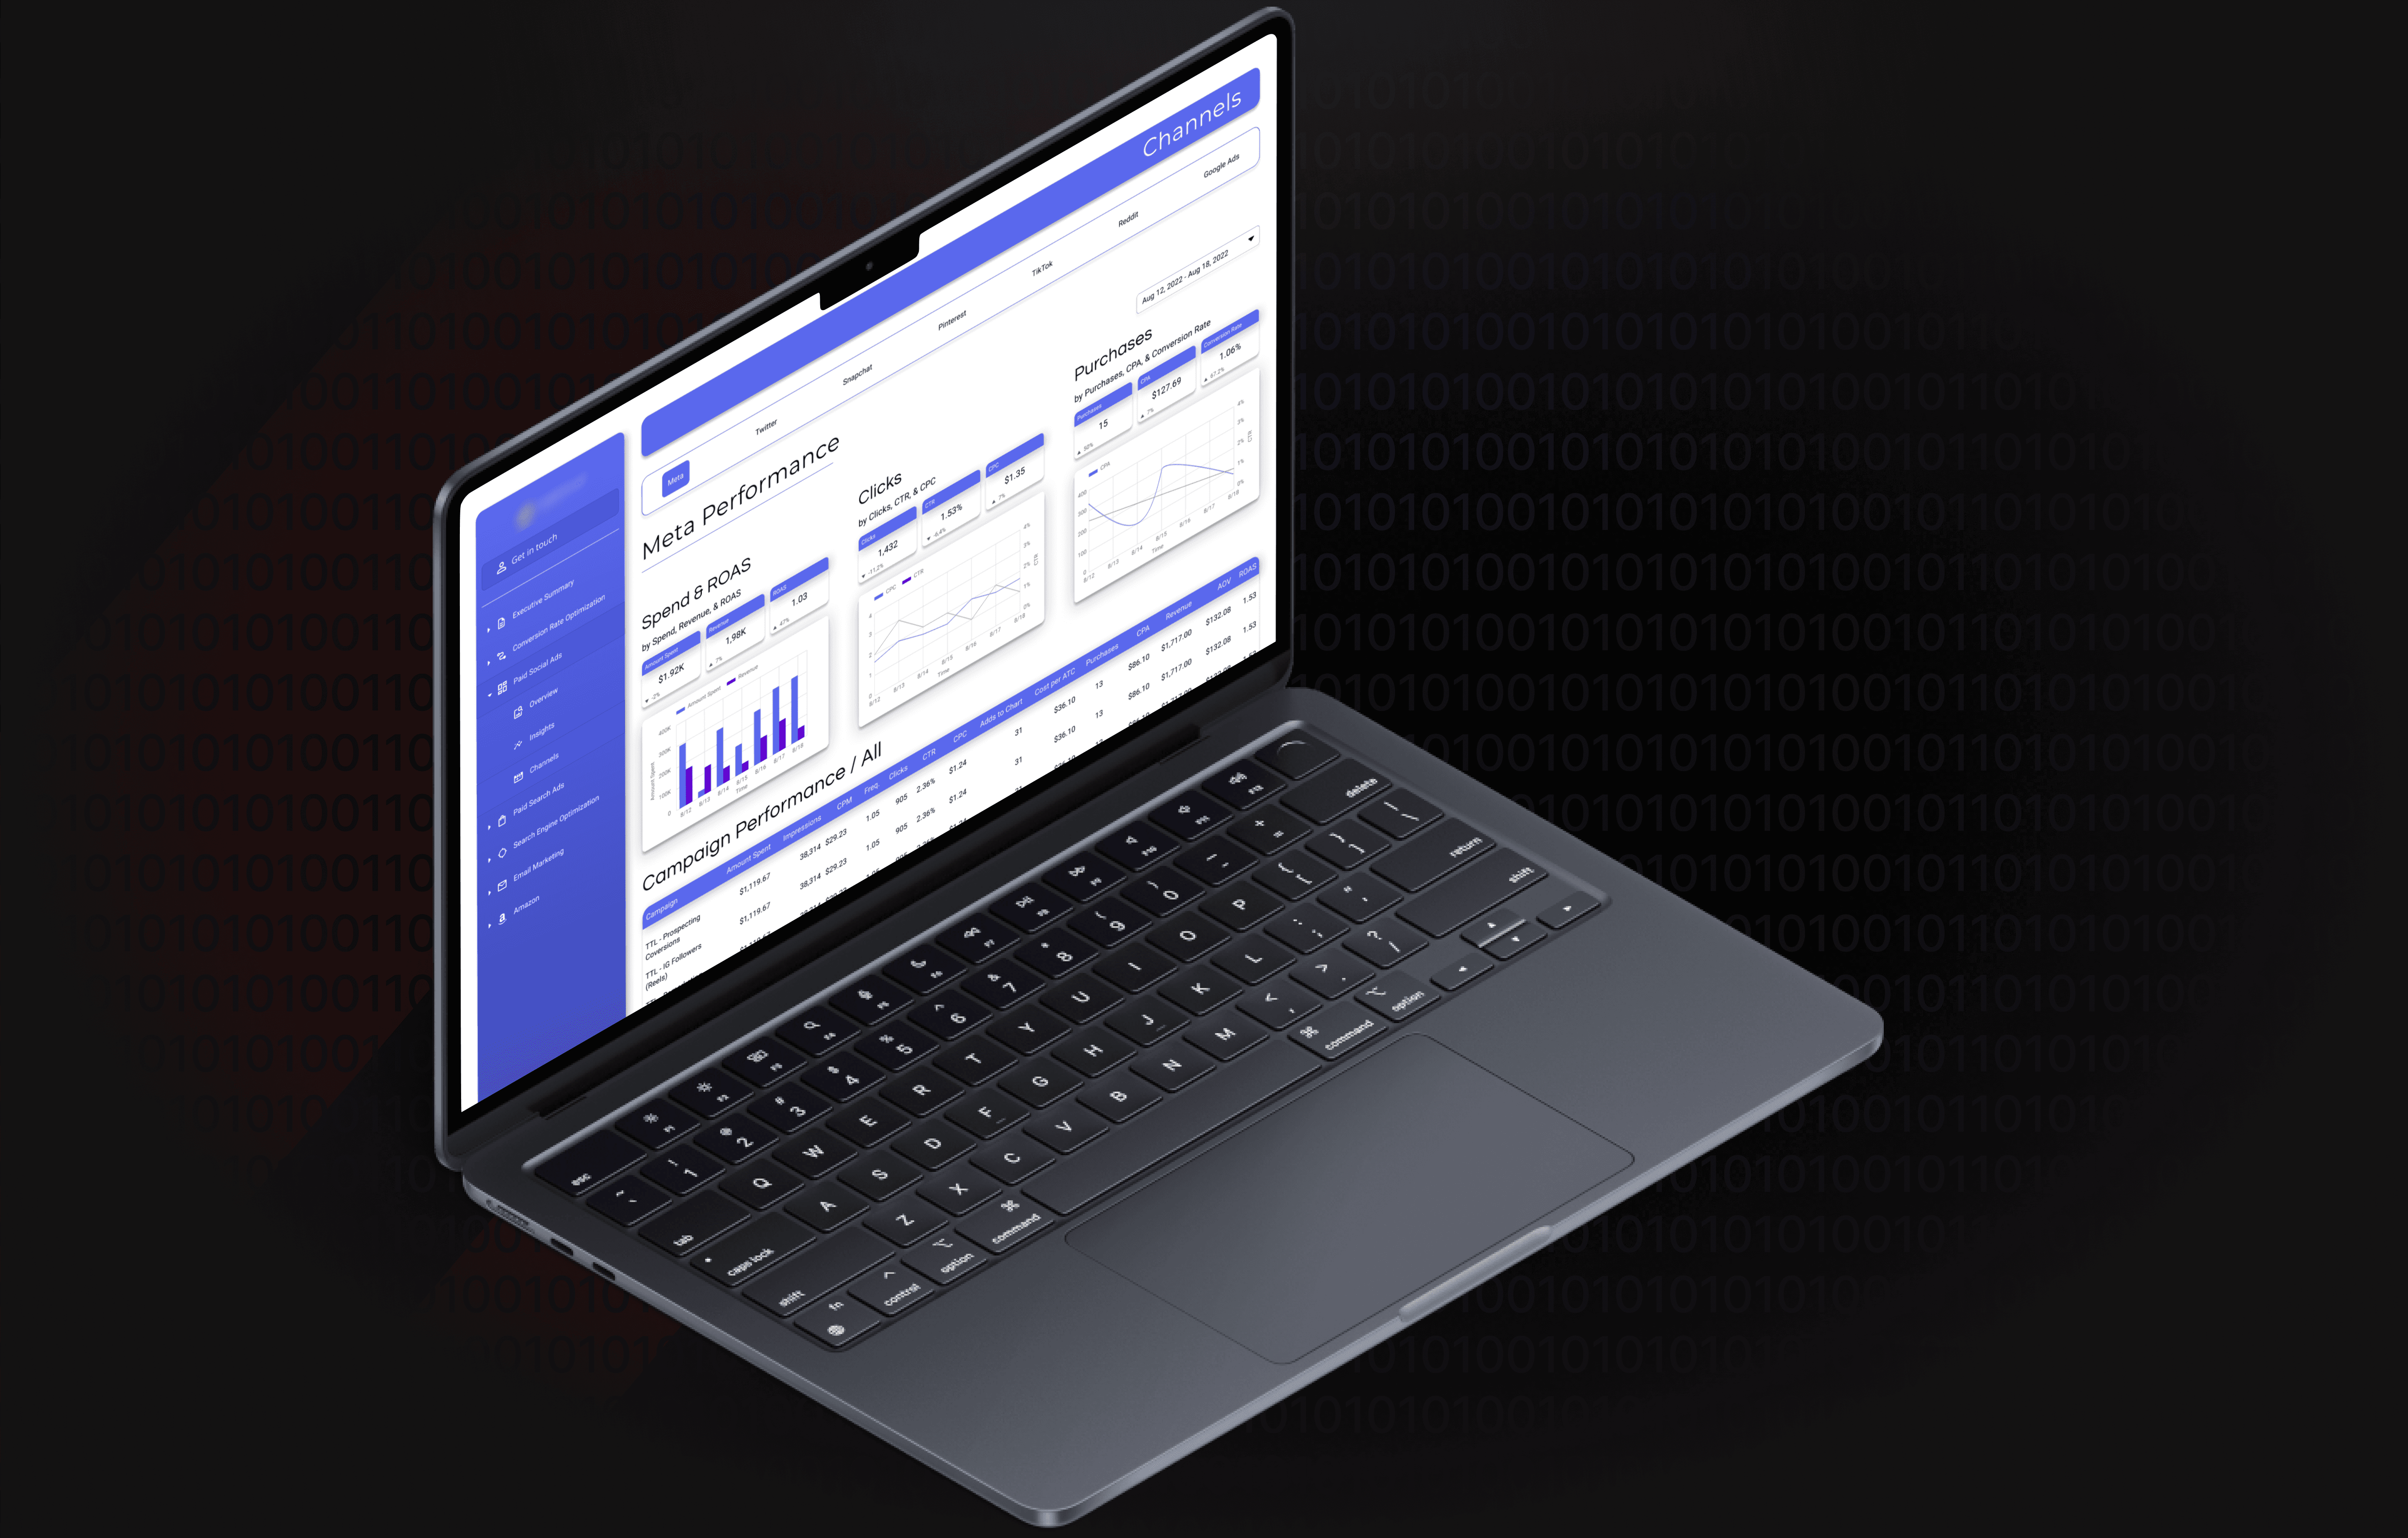
Self-Service, Always-On Access
The dashboard was accessible across devices with no login friction—allowing clients to check performance whenever they needed without relying on static PDFs or email threads.
—————————————————————————————————————
Impact
65% Reduction in Weekly Reporting Hours
Account managers saved an average of 8 hours per week previously spent generating custom reports—freeing time for strategy and optimization.
4× Client Portal Engagement Rate
Clients accessed the dashboard more frequently and independently, increasing engagement with performance data and reducing support queries.
17% Faster Client Decision-Making
With real-time access and simplified views, clients made quicker campaign decisions—resulting in faster A/B test cycles and improved ad spend efficiency.