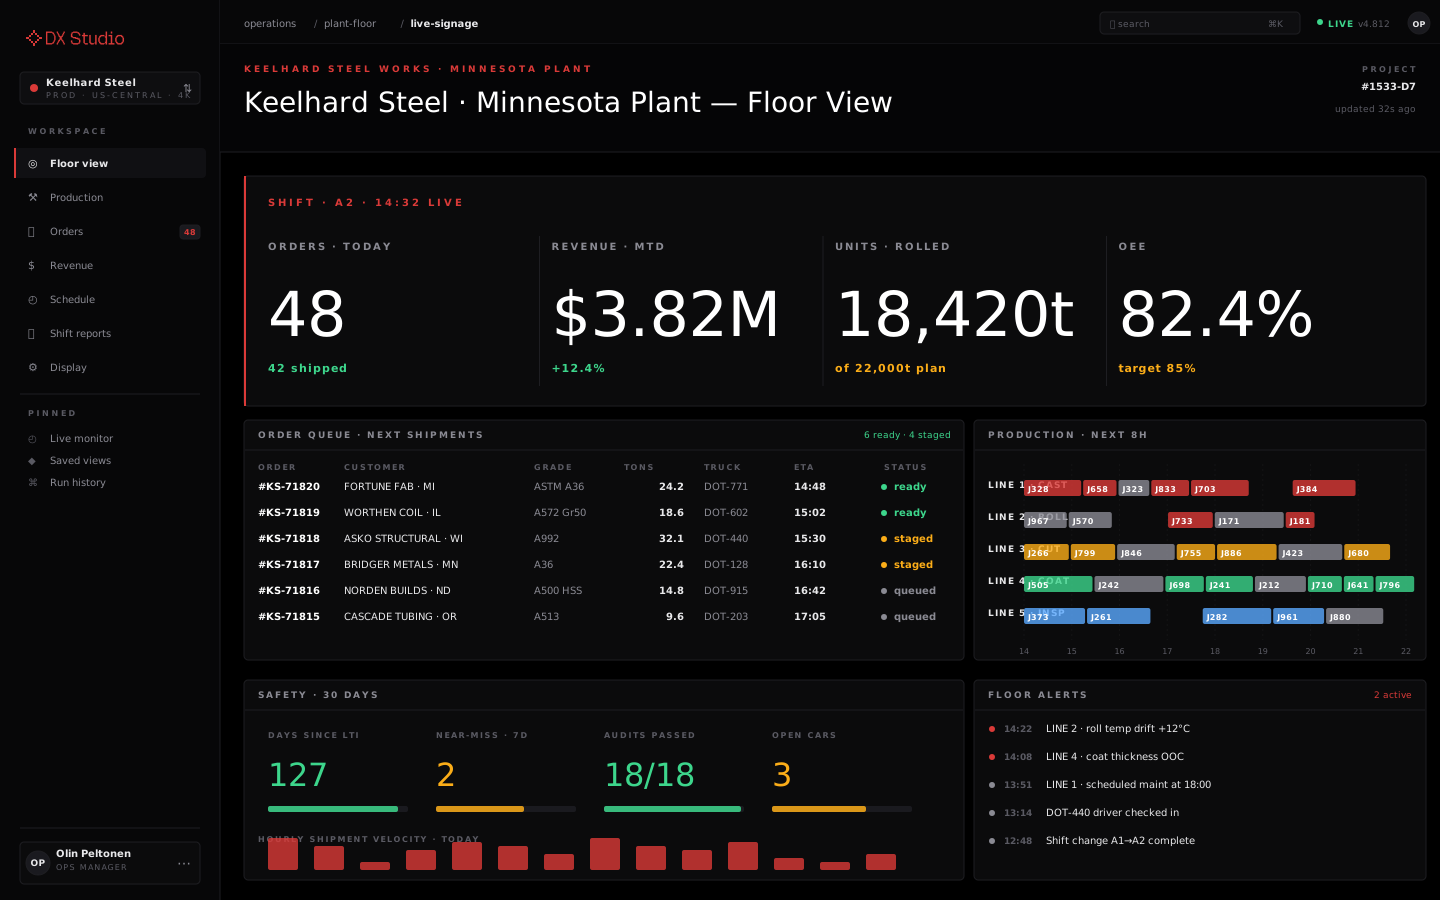
Helping a Minnesota-based furniture and lighting company bring live sales, order, and scheduling data onto a high-resolution dashboard designed for 4K digital signage across production floors and office spaces.
The client is a fast-growing manufacturer in the furniture and lighting industry, specializing in high-end, custom-designed products distributed across North America. With rapid order flow and a high-volume production environment, leadership needed a clearer way to connect sales performance, order activity, logistics, and production timelines in real time.
Most of the company’s critical operational data already existed across Shopify, calendar systems, and internal order logs. The problem was that teams could not easily see this information together. Daily coordination still depended heavily on manual tracking, verbal updates, and disconnected reporting, creating delays between what was happening in the business and what teams could actually see.
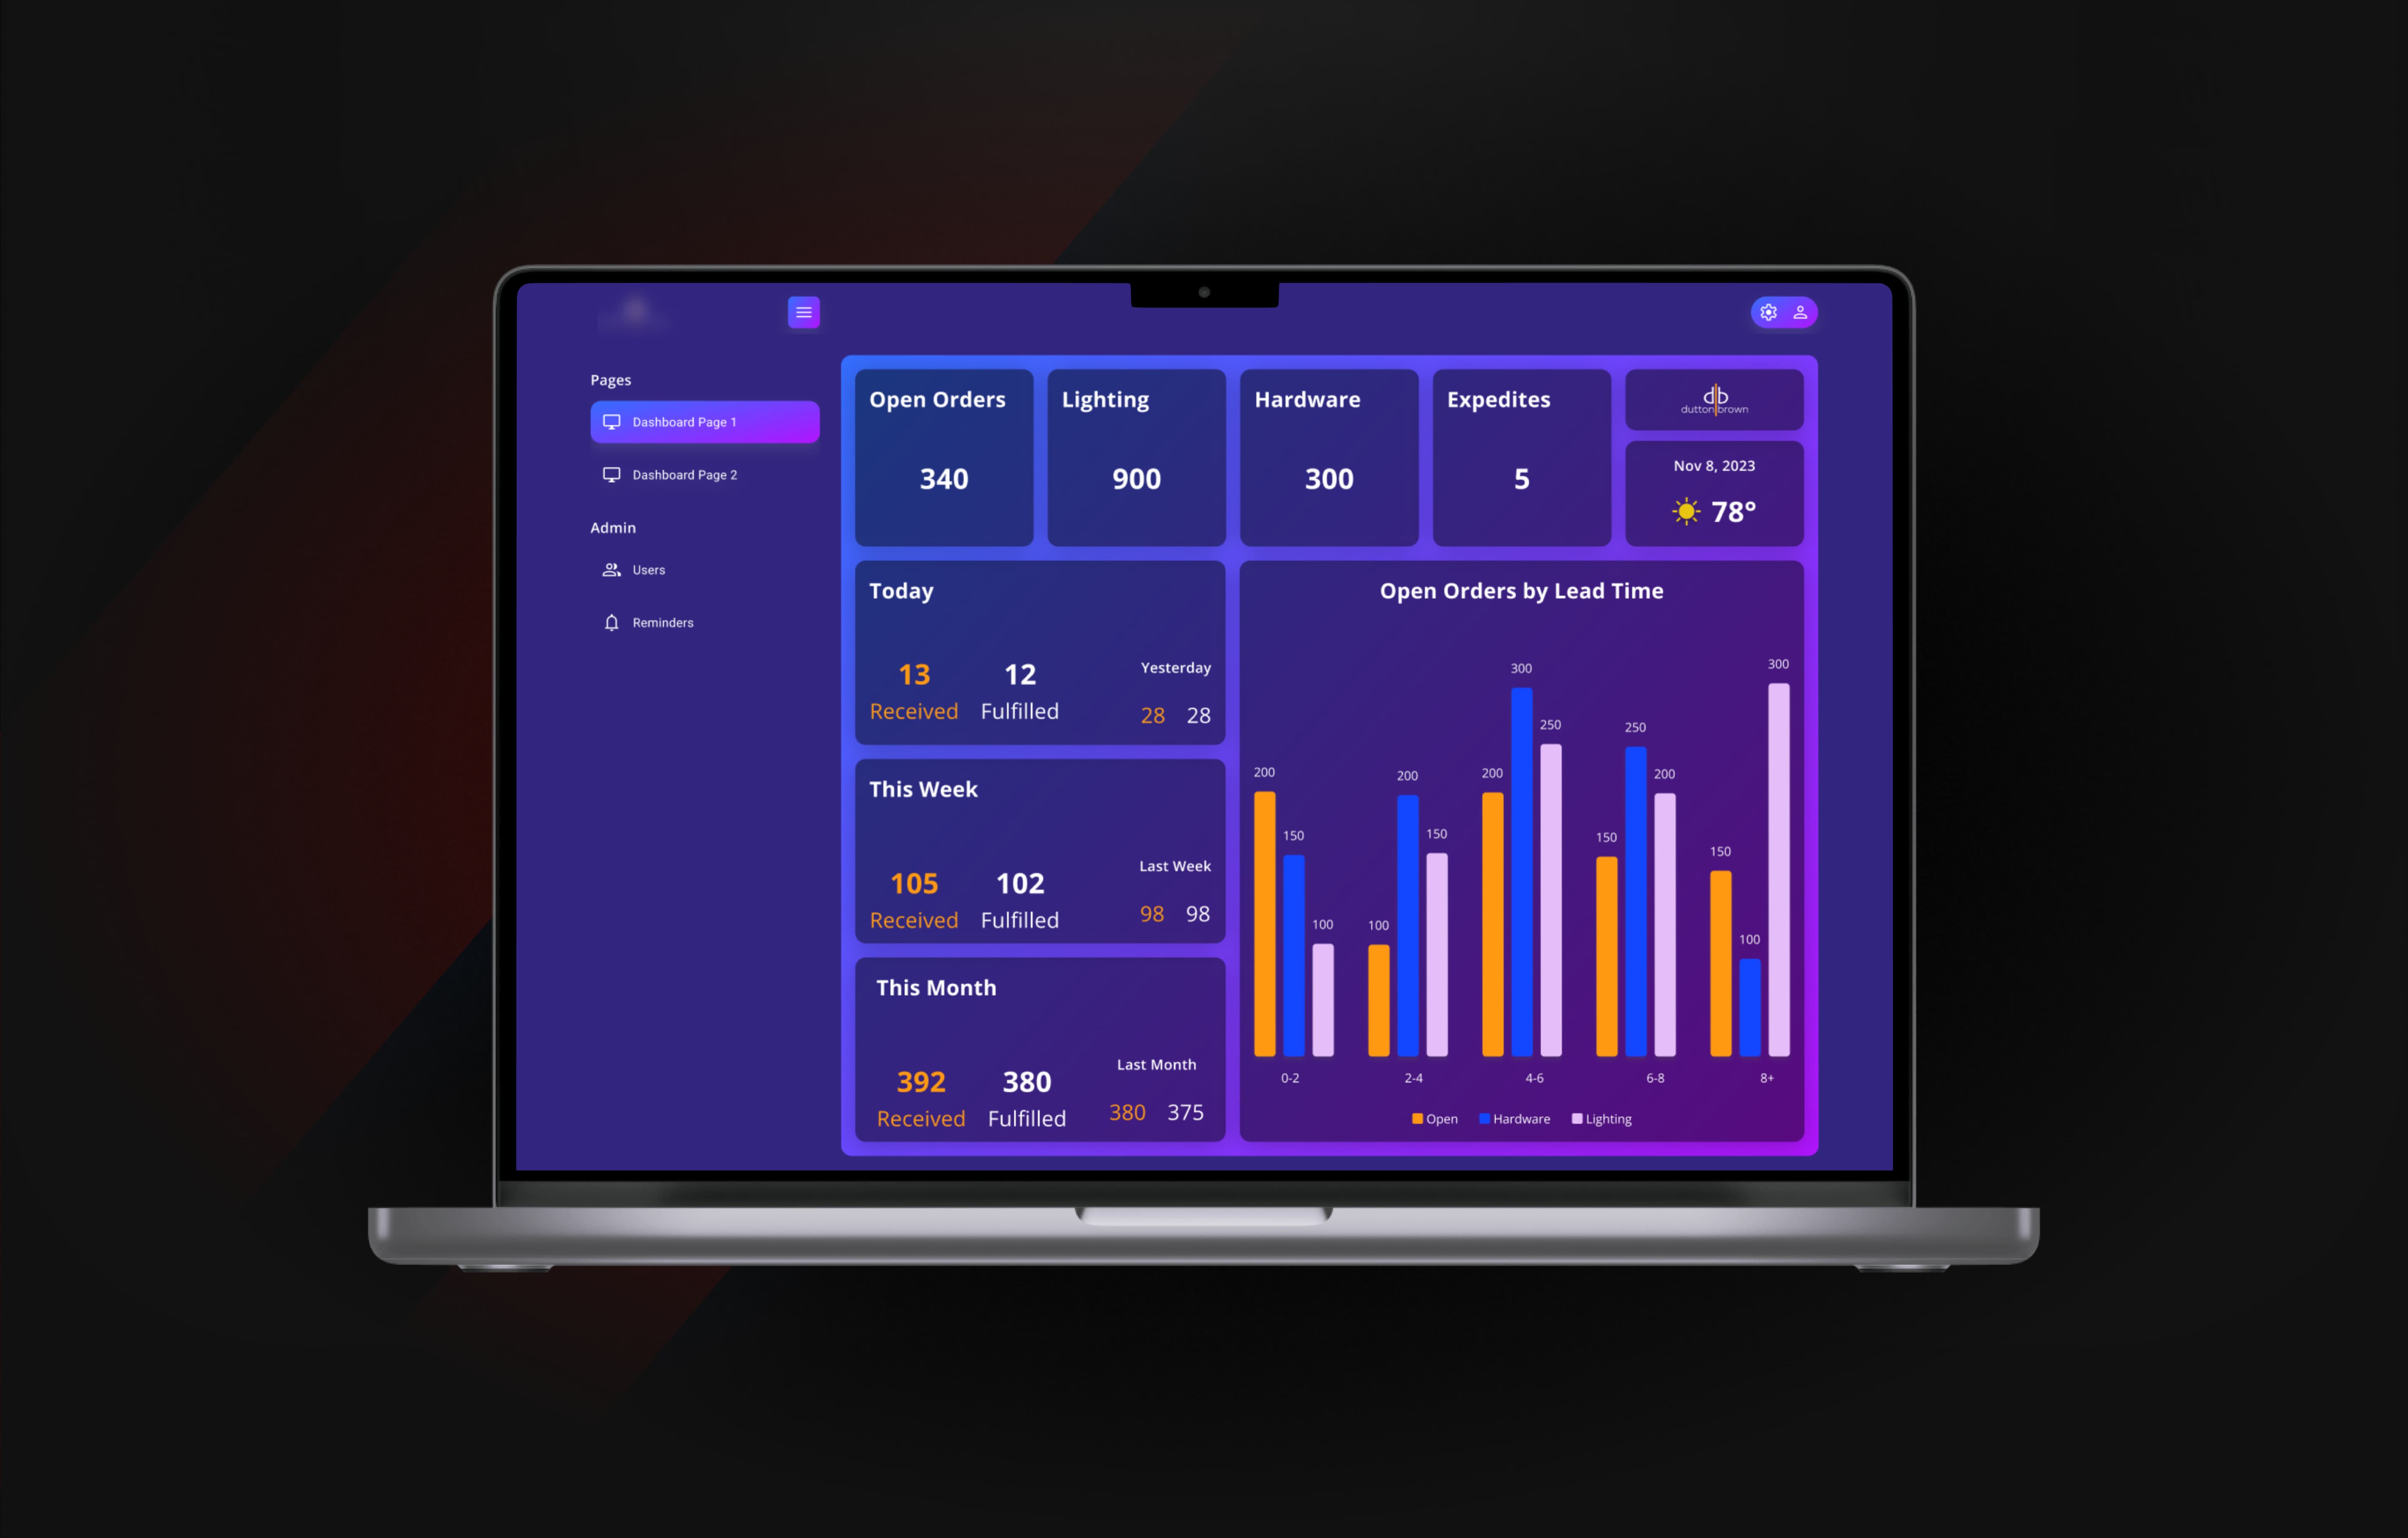
The challenge was building a real-time dashboard that worked both technically and visually at 4K scale.
The dashboard needed to do more than display numbers. It had to be readable from a distance, visually balanced on large screens, continuously updated, and reliable enough to support day-to-day operational awareness.
Building for 4K digital signage introduced additional design and engineering complexity. Typography, spacing, contrast, screen ratios, and layout density all had to be carefully planned so the dashboard would remain clear on ultra-high-definition displays. At the same time, backend synchronization had to keep sales, orders, and scheduling data fresh without adding manual work for the team.
The goal was to create a live operational display that could unify fragmented business data and make performance visible across departments throughout the day.
We built a React-based 4K dashboard connected to a secure cloud data layer.
The solution was developed as a responsive React.js application optimized specifically for ultra-high-definition screen resolutions. The interface was designed to preserve clarity, hierarchy, and visual consistency on large-format 4K displays used in manufacturing and office environments.
AWS Lambda functions were used to process live data streams from Shopify and internal systems, while Google Firebase supported authentication and real-time database updates. This created a secure, scalable backend that could keep dashboard data synchronized without requiring manual refreshes or repetitive reporting.
The visual system was designed and tested for large-screen readability.
Before implementation, the dashboard interface was planned in Figma using pixel-accurate 4K mockups. This helped define typography, spacing, component sizing, and visual hierarchy around the realities of digital signage rather than standard desktop viewing.
Because direct access to physical 4K displays was limited during development, the team used virtual simulation and layered compatibility testing to validate rendering quality, screen ratio behavior, refresh timing, and layout accuracy. This ensured the dashboard would perform reliably once deployed on actual signage screens.
Integrated Shopify, calendar systems, and internal order data into one real-time dashboard
Built a React.js interface optimized for 4K digital signage
Used AWS Lambda and Firebase for live updates, authentication, and scalable infrastructure
Designed pixel-accurate 4K layouts in Figma for better readability
Increased operational data visibility by 85%
Improved operational efficiency by 21%
The result was a more visible and coordinated sales operation.
The final dashboard helped the client move from fragmented updates to a shared real-time operating view. Production, logistics, sales, and leadership teams could monitor order flow, sales activity, and scheduling priorities from one clear interface.
By combining 4K-ready interface design with secure cloud infrastructure, the system improved cross-department transparency, reduced coordination overhead, and gave the company a stronger foundation for data-driven operational growth.
The value of the dashboard was not only in showing sales data on a large screen, but in making real-time business activity visible to the teams responsible for acting on it.
More works.

" height="56.88889185587561px" id="STzxULXmg" transform="translate(3.556 3.556)" width="56.8888918558755px"/></g></svg>)
Operational Efficiency Enhancement
Operational Efficiency Enhancement Dashboard
Helping a US-based, youth development nonprofit organization, streamline reporting and enhance operational efficiency with real-time dashboards that automate workflows and improve decision-making.
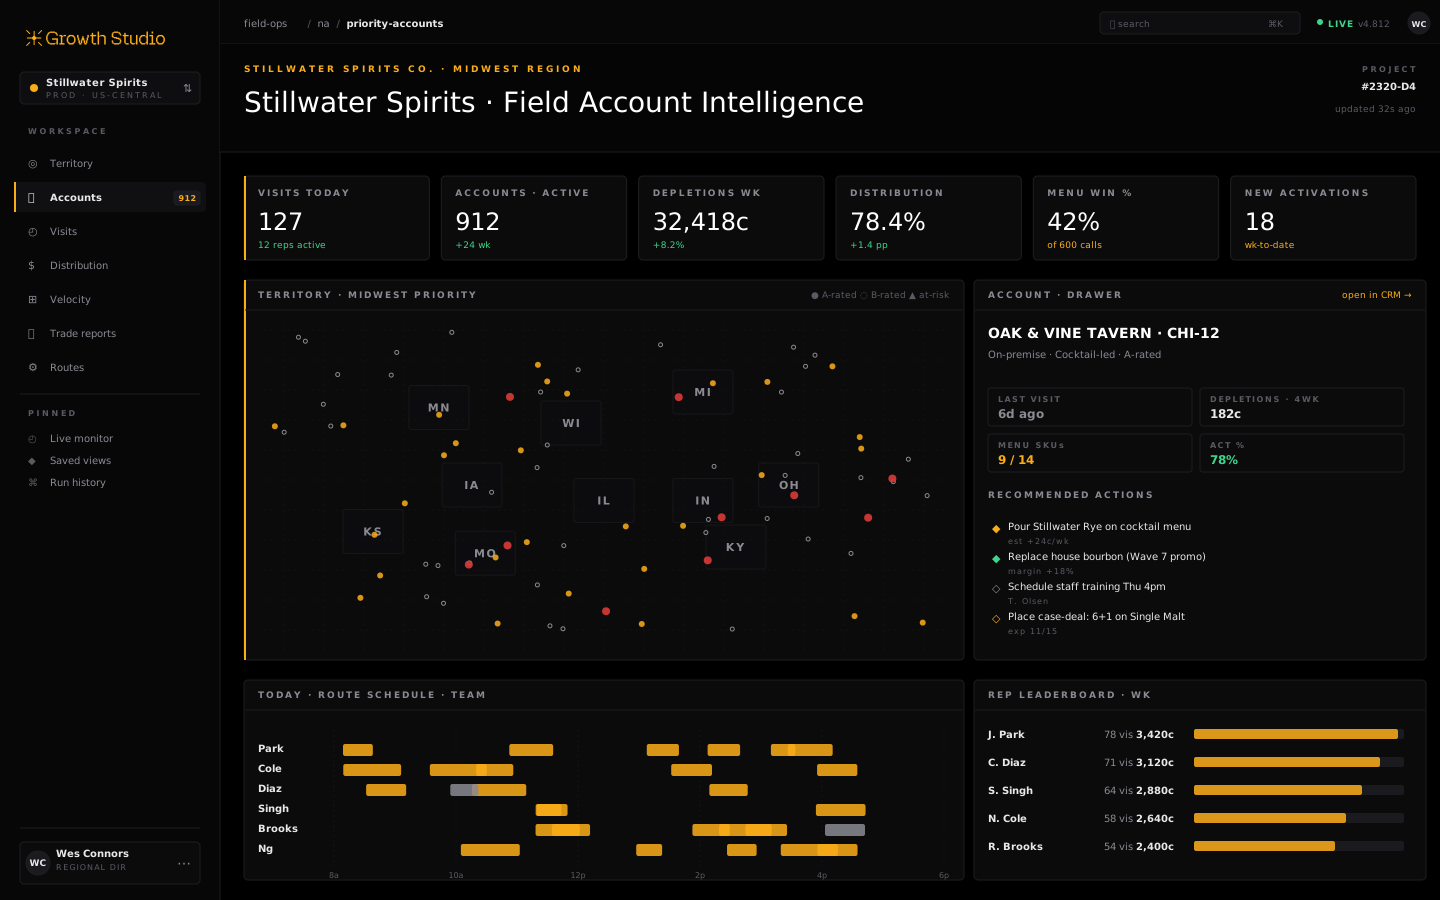
Interactive Sales Intelligence
Interactive Sales Intelligence Dashboard
Transforming a US-Based, Global Premium Spirits Company’s sales operations with precision targeting and mobile-first insights. By combining internal data with real-world restaurant insight.
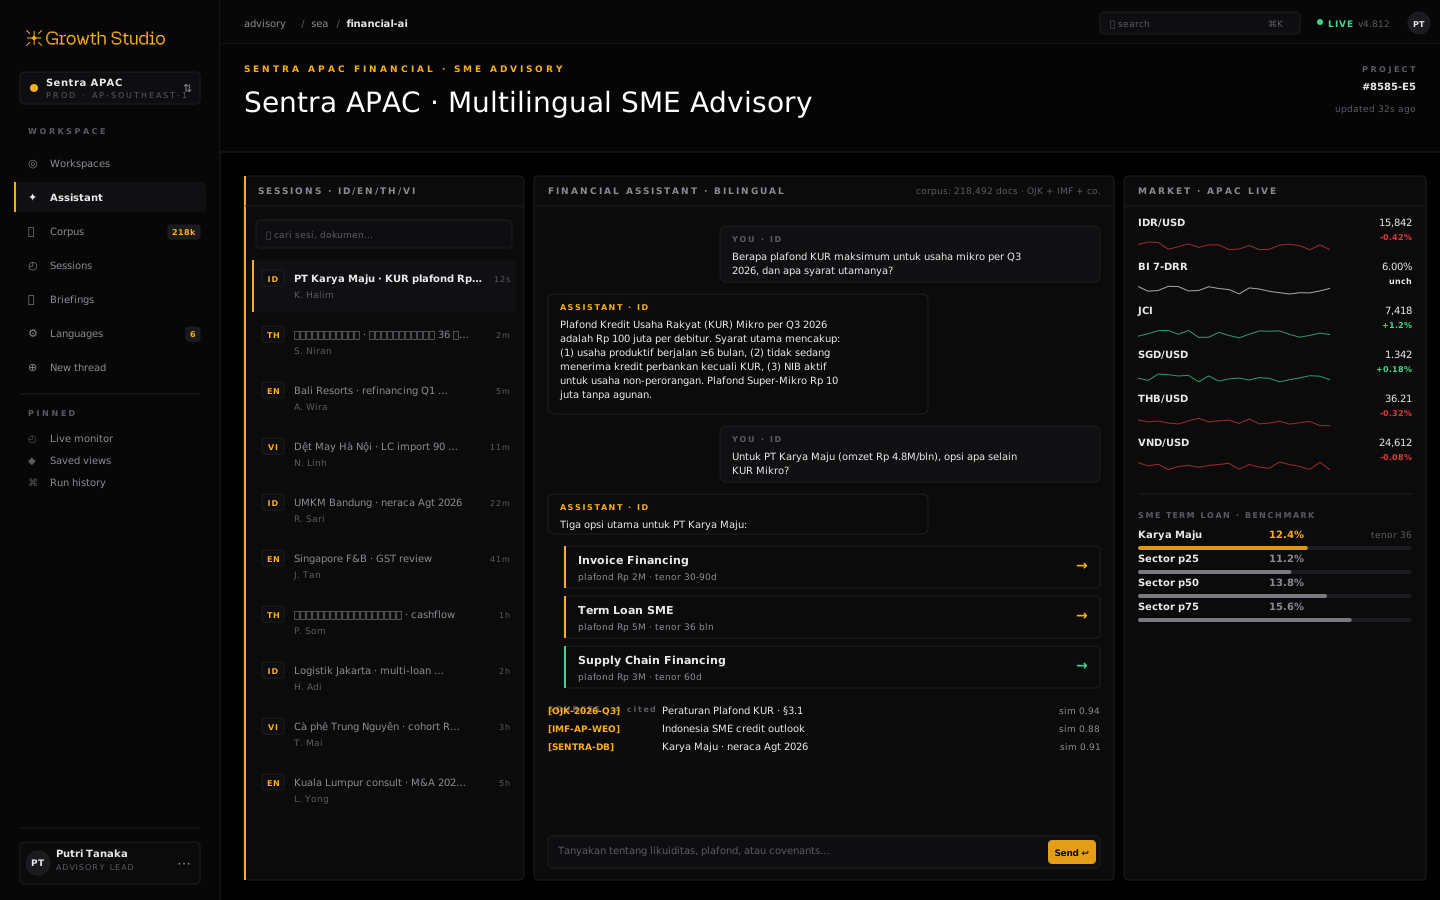
AI-Driven Financial Insights Platform for SMEs
AI-Driven Financial Insights Platform for SMEs
A multilingual, AI-powered financial intelligence platform that centralizes data, enables instant insights, and empowers Southeast Asian SMEs to make confident, data-driven decisions.