
Orhan Gazi Yalçın
10 Min Read
R is a highly powerful and versatile programming language widely employed in data analysis. It is open-source and has a vast community of developers contributing to its development and maintenance.

Introduction
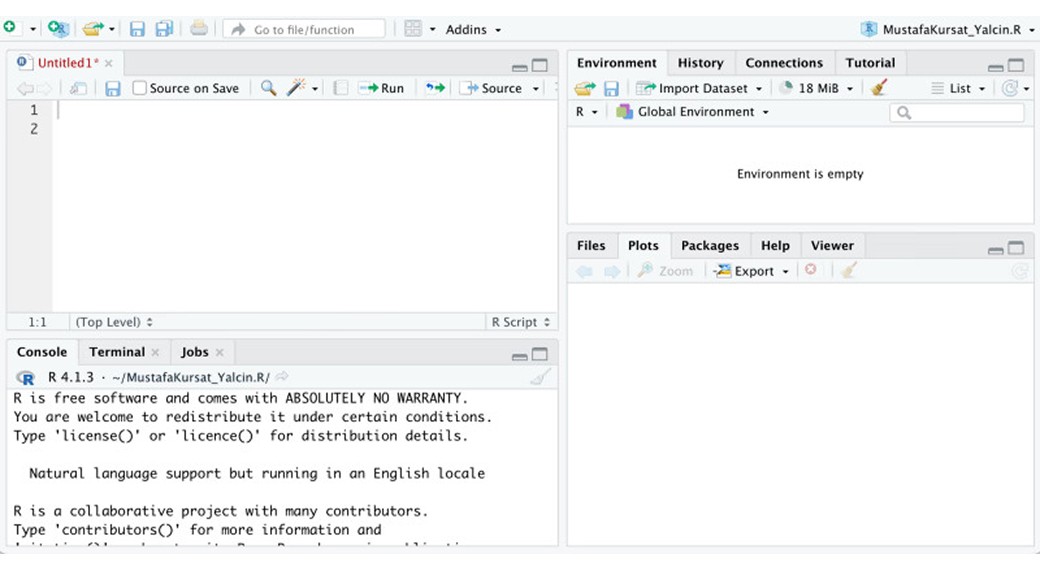
Quick info: The name RStudio has been changed to ‘‘Posit’’ in 2022. So, we will refer to it as Posit throughout the rest of this article.
This blog will focus on R and data analysis, applications of R, data visualization, and big data analysis. Here is the overview of the subtopics:
The Basics
Utilizing R for Data Analysis Applications
Comparisons of R with Other Technological Alternatives
Techniques for Data Analysis in R
Data Visualization with R
The Benefits of Utilizing R Libraries in the Business Setting
Analyzing Big Data with R
The Basics
What is Data Analysis?
Data analysis is the process of utilizing statistical and computational techniques to evaluate data, extract insights, and make informed decisions. This includes tasks such as collecting, cleaning, and organizing data and applying advanced statistical models and algorithms to uncover patterns, trends, and relationships within the data.
The ultimate goal of data analysis is to convert raw data into actionable insights that can be leveraged to inform business strategies, optimize operations, and gain a competitive edge.
What is R, then?
R is a highly powerful and versatile programming language widely employed in data analysis. It is open-source and has a vast community of developers contributing to its development and maintenance.
R is renowned for its robust data visualization capabilities, ability to handle large datasets and an extensive collection of packages that facilitate the execution of complex data analysis tasks.
R’s packages, such as dplyr, ggplot2, caret, and many others, are widely used in data analysis. R can be used for tasks such as data cleaning, data manipulation, statistical analysis, machine learning, deep learning, and even creating interactive visualizations.
R’s extensive library of packages and tools makes it a versatile and powerful tool for data analysis, and its popularity is continuously growing.
Analyzing Big Data with R
Utilizing R for Data Analysis Applications
Data Analysis by R is beneficial in various fields, providing valuable insights and helping organizations make better decisions. Some of the key areas where R can be used for data analysis include:
Customer data analysis
Sales data analysis
Financial data analysis
Healthcare data analysis
Social media data analysis
Biological data analysis
Environmental data analysis
Let’s dive in!
Customer Data Analysis:
R can be used to analyze customer data to gain insights into customer behavior, preferences, and demographics. This can help businesses understand their target market and improve their marketing strategies.
Sales Data Analysis
R can be used to analyze sales data to identify patterns and trends in sales, such as seasonality or product popularity. This can help businesses optimize their inventory and pricing strategies.
Financial Data Analysis
R can be used to analyze financial data such as stock prices, financial statements, and economic indicators. This can help businesses make better investment decisions and forecast future trends.
Healthcare Data Analysis
R can be used to analyze medical data to identify patterns and trends in patient health, treatment outcomes, and disease progression. This can help healthcare providers improve patient care and develop new treatment strategies.
Social media Data Analysis
R can be used to analyze social media data to gain insights into user behavior, preferences, and demographics. This can help businesses improve their social media marketing strategies.
Biological Data Analysis
R can be used to analyze biological data such as gene expression and proteomics data to identify patterns and trends in genetic and molecular information. This can help researchers make new discoveries in the field of biology.
Environmental Data Analysis
R can be used to analyze environmental data such as weather, air quality, and climate data. This can help organizations make better decisions and develop strategies to address environmental challenges.
Comparisons of R with Other Technological Alternatives
R is similar to other programming languages, such as Python, MATLAB, and SAS, in that it can be used for data analysis and visualization. However, R has some distinct features and advantages that set it apart from other technologies.
One of the main advantages of R is its powerful data visualization capabilities. R has several libraries, such as ggplot2, lattice, and plotly, specifically designed for data visualization. These libraries are highly customizable and can create beautiful and informative visualizations.
Another advantage of R is its large number of packages. R has a wide range of packages specifically designed for data analysis and statistics, such as dplyr, caret, and randomForest. These packages make it easy to perform complex data analysis tasks within R, such as data cleaning, data manipulation, statistical analysis, and machine learning.
R also has a strong focus on reproducibility and collaboration. R Markdown, Shiny, and RStudio Connect are some of the tools that allow users to create interactive documents, dashboards, and web-based applications. This makes it easy to share and collaborate on data analysis projects.
Techniques for Data Analysis in R
A step-by-step guide on various data analysis techniques such as linear regression, time series analysis, clustering, classification, and survival analysis using R.
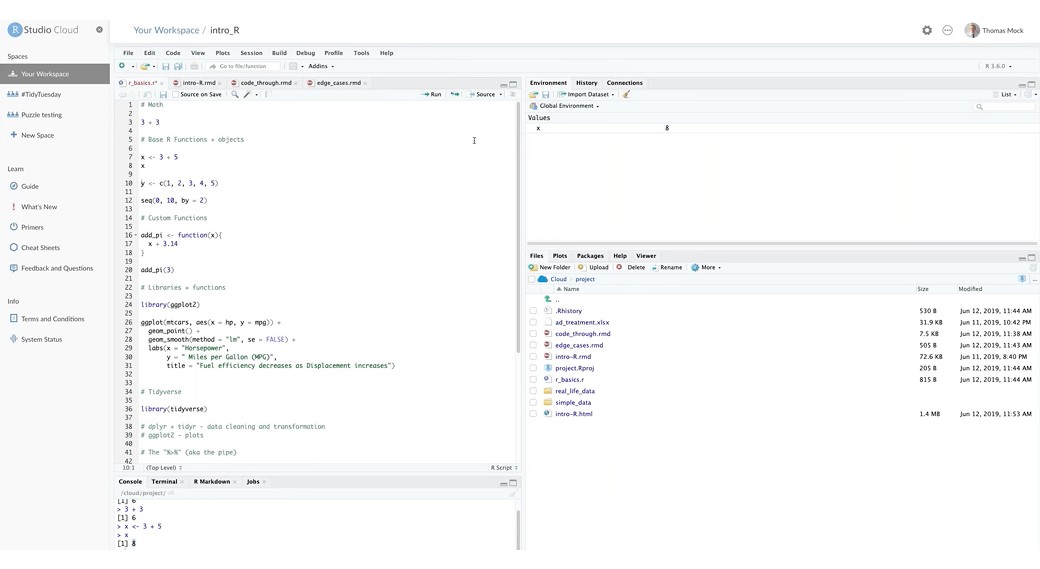
R is a powerful tool for data analysis and provides a wide range of techniques for analyzing data. Here is a step-by-step guide on how to perform various data analysis techniques using R:
Linear Regression
Linear Regression: Linear regression is a statistical technique that is used to model the relationship between a dependent variable and one or more independent variables. Businesses can use this technique to analyze sales, customer behavior, and financial performance data to identify trends and predict future outcomes.
# Perform linear regressionmodel <- lm(y ~ x1 + x2, data = data)
Time Series Analysis
Time Series Analysis: Time series analysis is a statistical technique used to analyze data collected over time. Businesses can use this technique to identify patterns and trends in data such as stock prices, sales, and customer behavior. This can help businesses make better decisions and forecast future trends.
# Create a time series objecttime_series <- ts(data, start = c(year, month, day), frequency = 12)# Decompose the time seriesdecomposed <- decompose(time_series)
Clustering
Clustering: Clustering is a technique used to group similar data points together. Businesses can use this technique to segment customers, products, or other data into different groups. This can help businesses identify patterns and trends within their data and make better decisions.
# Perform clusteringclusters <- kmeans(data, 3)
Classification
Classification: Classification is a technique used to predict a categorical outcome based on a set of input variables. Businesses can use this technique to analyze customer demographics, purchase history, and other data to identify patterns and make predictions about future outcomes.
# Perform classificationmodel <- train(y ~ x1 + x2, data = data, method = "rf")
Survival Analysis
Survival Analysis: Survival analysis is a statistical technique used to analyze data collected over time. Businesses can use this technique to analyze customer retention, product lifespan, and other data to identify patterns and trends. This can help businesses make better decisions and forecast future trends.
Data Visualization with R
A detailed explanation of the libraries and tools available in R for data visualization and its powerful capabilities.
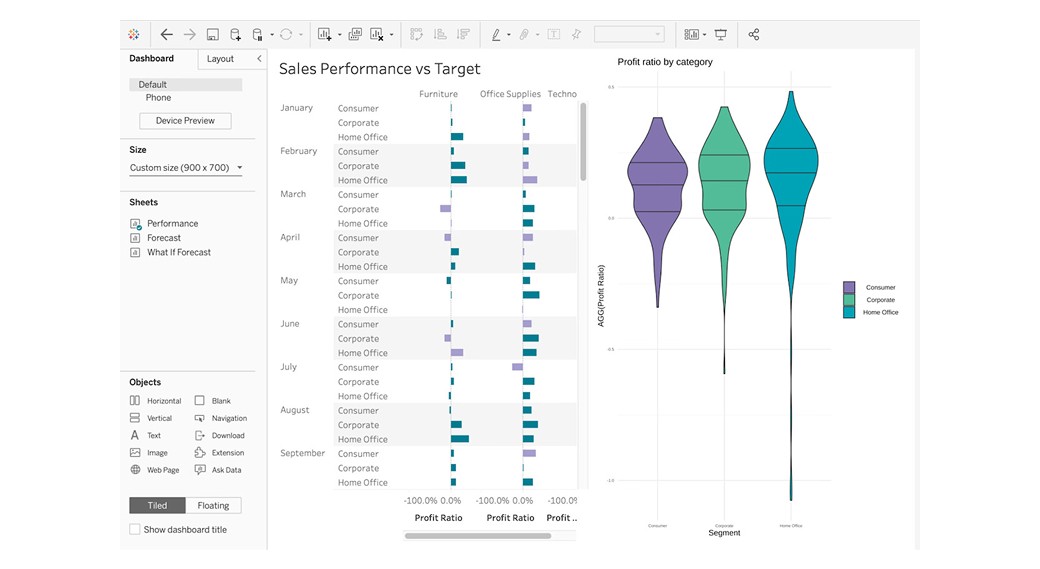
Data visualization is a critical component of data analysis as it helps to make complex data more understandable and accessible. R is a powerful data visualization tool with many libraries and tools available for creating beautiful and informative visualizations.
One of the most popular libraries for data visualization in R is ggplot2. ggplot2 is a grammar of graphics library that allows users to create complex visualizations using a simple and intuitive syntax. It is known for its ability to create elegant and sophisticated visualizations, and data analysts and statisticians widely use it.
Another popular library in R for data visualization is lattice. It is an alternative to ggplot2 and provides a high-level interface for creating multi-panel plots. lattice is particularly useful for creating visualizations of multivariate data and has a number of built-in plot types.
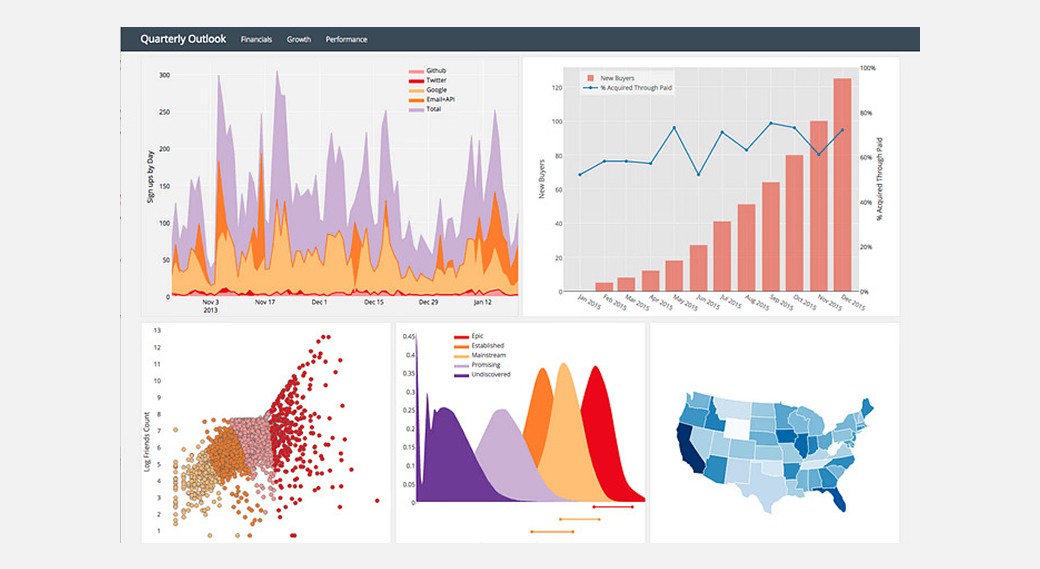
Plotly is another library widely used for data visualization in R. Plotly is an open-source library for creating interactive visualizations. It allows users to create dynamic and interactive plots that can be embedded in websites and shared online.
Shiny is a package in R that allows users to create interactive web-based applications. Shiny can be used to create interactive visualizations and dashboards that can be shared and accessed by others.
The Benefits of Utilizing R Libraries in the Business Setting
Libraries (ggplot2, lattice, Plotly, Shiny) provide many benefits to business people, which can use them to increase efficiency and improve profit-making. Here are the five of the most important effects:
Improved data communication
Enhanced data exploration
Increased efficiency
Online sharing and collaboration
Presentation advantage
Improved Data Communication
Libraries in R allow business people to create interactive web-based applications that can help to make complex data more understandable and accessible to stakeholders. This can help to streamline communication and decision-making processes, making it easier to identify areas for improvement and growth.
Enhanced Data Exploration
Libraries’ interactive web-based applications allow business people to explore their data in new ways and discover insights that might be difficult to uncover with static visualizations.
Increased Efficiency
Libraries’ packages allow business people to create interactive visualizations and dashboards with minimal coding effort. This can save time and increase productivity, allowing them to focus on other important tasks.
Online Sharing and Collaboration
Libraries in R allow business people to share their interactive web-based applications online, which makes it easy for stakeholders to access and explore the data. This can increase collaboration and improve decision-making processes.
Presentation Advantage
Libraries in R can help business people to create visually appealing and interactive web-based applications that can be shared and accessed by others. This can increase the reach of their data and insights and strengthen their credibility and impact. Furthermore, it can be used to create interactive dashboards that can be accessed by different departments or stakeholders within an organization, which can help to improve collaboration and decision-making.
Analyzing Big Data with R
R is a highly powerful and versatile programming language widely employed in data analysis. It is open-source and has a vast community of developers contributing to its development and maintenance.


