
Orhan Gazi Yalçın
7 Min Read
In this blog post, we examine Looker Studio, Tableau and Power BI and their benefits. No-code BI tools are helpful for companies who haven't technical knowledge. Those tools are helpful.

Introduction
Companies constantly search for ways to boost efficiency and maximize profits in today’s rapidly evolving business landscape. One effective strategy that many organizations have adopted is the use of dashboard development solutions. These tools enable companies to track key performance indicators (KPIs) and make data-driven decisions that help them optimize operations and increase profitability.
No-code BI Dashboard Technologies Offer A Range of Benefits To Their Customers.
One of the key advantages of no-code BI dashboard builders is their ability to save time and reduce workload. These tools allow users to rapidly and easily connect to various data sources, including spreadsheets, databases, and cloud-based applications, and create dashboards that can be shared with colleagues and stakeholders. This helps teams stay updated on their data and make informed decisions without spending hours manually compiling and analyzing data.
In this blog post, we will cover the following BI tools in detail:
In the first part of the blog, we aim to delve into three innovative no-code BI technologies’ key features and benefits and discuss how businesses can leverage them to drive growth and success.
In the second part of the post, we will compare No-Code and custom Coded solutions, examining factors such as adaptability, flexibility, pricing structure, and customization options. By the end, you’ll have a clear understanding of which solution is best suited for your business needs.
Finally, we will examine how these technologies can benefit your organization, from streamlining internal processes to driving external profits. Stay tuned for an in-depth look at how these cutting-edge technologies can help your business thrive in today’s competitive landscape.
Let’s dive in…
What is Tableau?
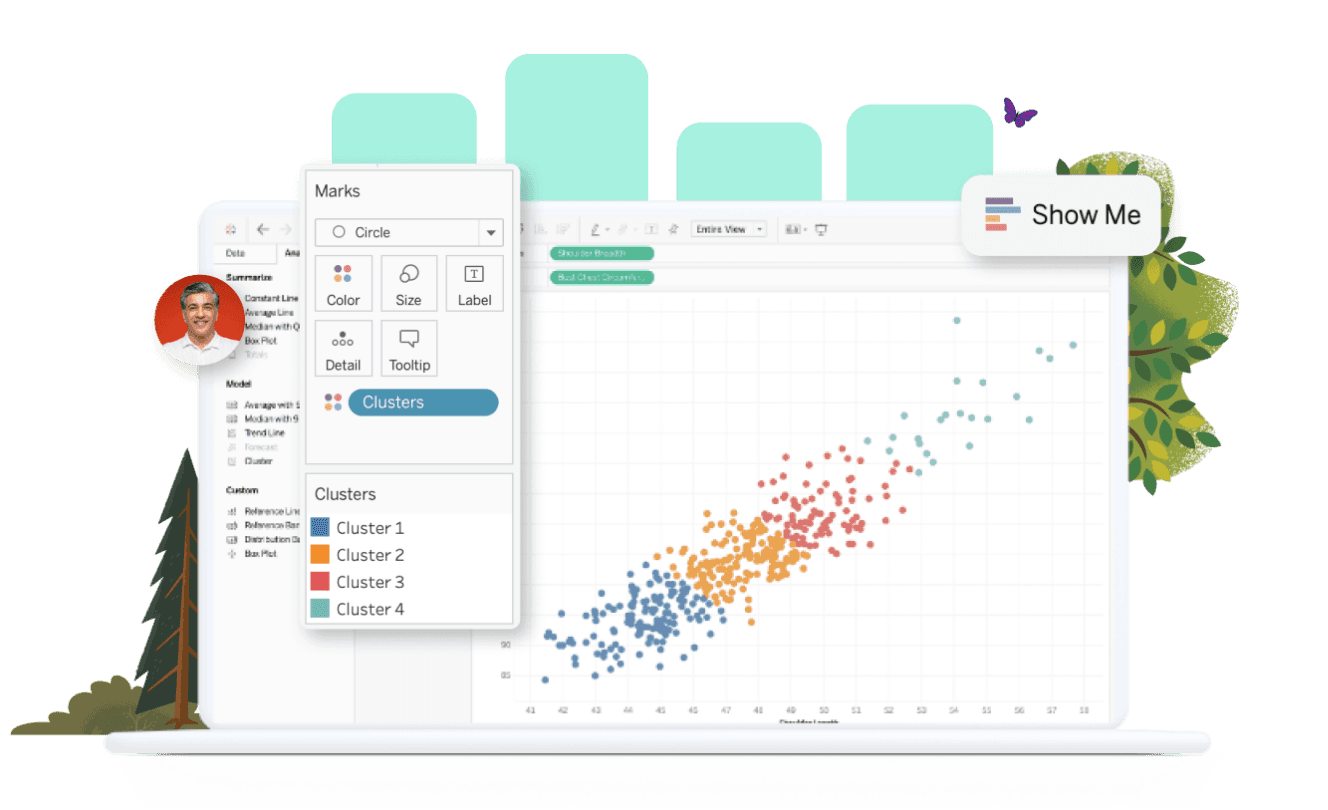
Tableau is a powerful data visualization and business intelligence tool that helps companies make better and more informed decisions by providing them with interactive, easy-to-understand visualizations of their data.
Data Transformation: One of the main benefits of using Tableau is its ability to quickly and easily transform raw data into meaningful and actionable insights. With just a few clicks, business users can create a wide variety of charts, graphs, and other visualizations that help them understand their data in new and deeper ways.
Flexibility and Customization Capabilities: Another key benefit of Tableau is its flexibility and customization capabilities. It can be easily integrated with many data sources, including Excel spreadsheets, databases, and cloud-based systems like Salesforce or Snowflake. This allows companies to pull in data from a variety of sources and create a single, comprehensive view of their business.
Advanced Analytical Features: In addition to its visualization capabilities, Tableau offers a range of advanced analytical features that help companies identify trends, patterns, and other insights that may take time to become apparent from their raw data. These features, combined with Tableau’s user-friendly interface, make it an ideal tool for business analysts, data scientists, and other professionals who need to quickly and effectively analyze large amounts of data.
So, why should your company consider using Tableau? The answer is simple: it can help you make better and more informed decisions by providing you with a clear, visual representation of your data. Whether you’re looking to optimize your sales and marketing efforts, improve operational efficiency, or make better decisions about your company’s future direction, Tableau can help you get there.
To start with Tableau, you only need a computer with an internet connection and a valid Tableau account. However, selecting the correct Tableau subscription can be tricky. You need to navigate carefully to find the ideal membership for your needs. Once you are set, you can easily connect to your data sources and begin creating visualizations that help you better understand your business.
What is Power BI?
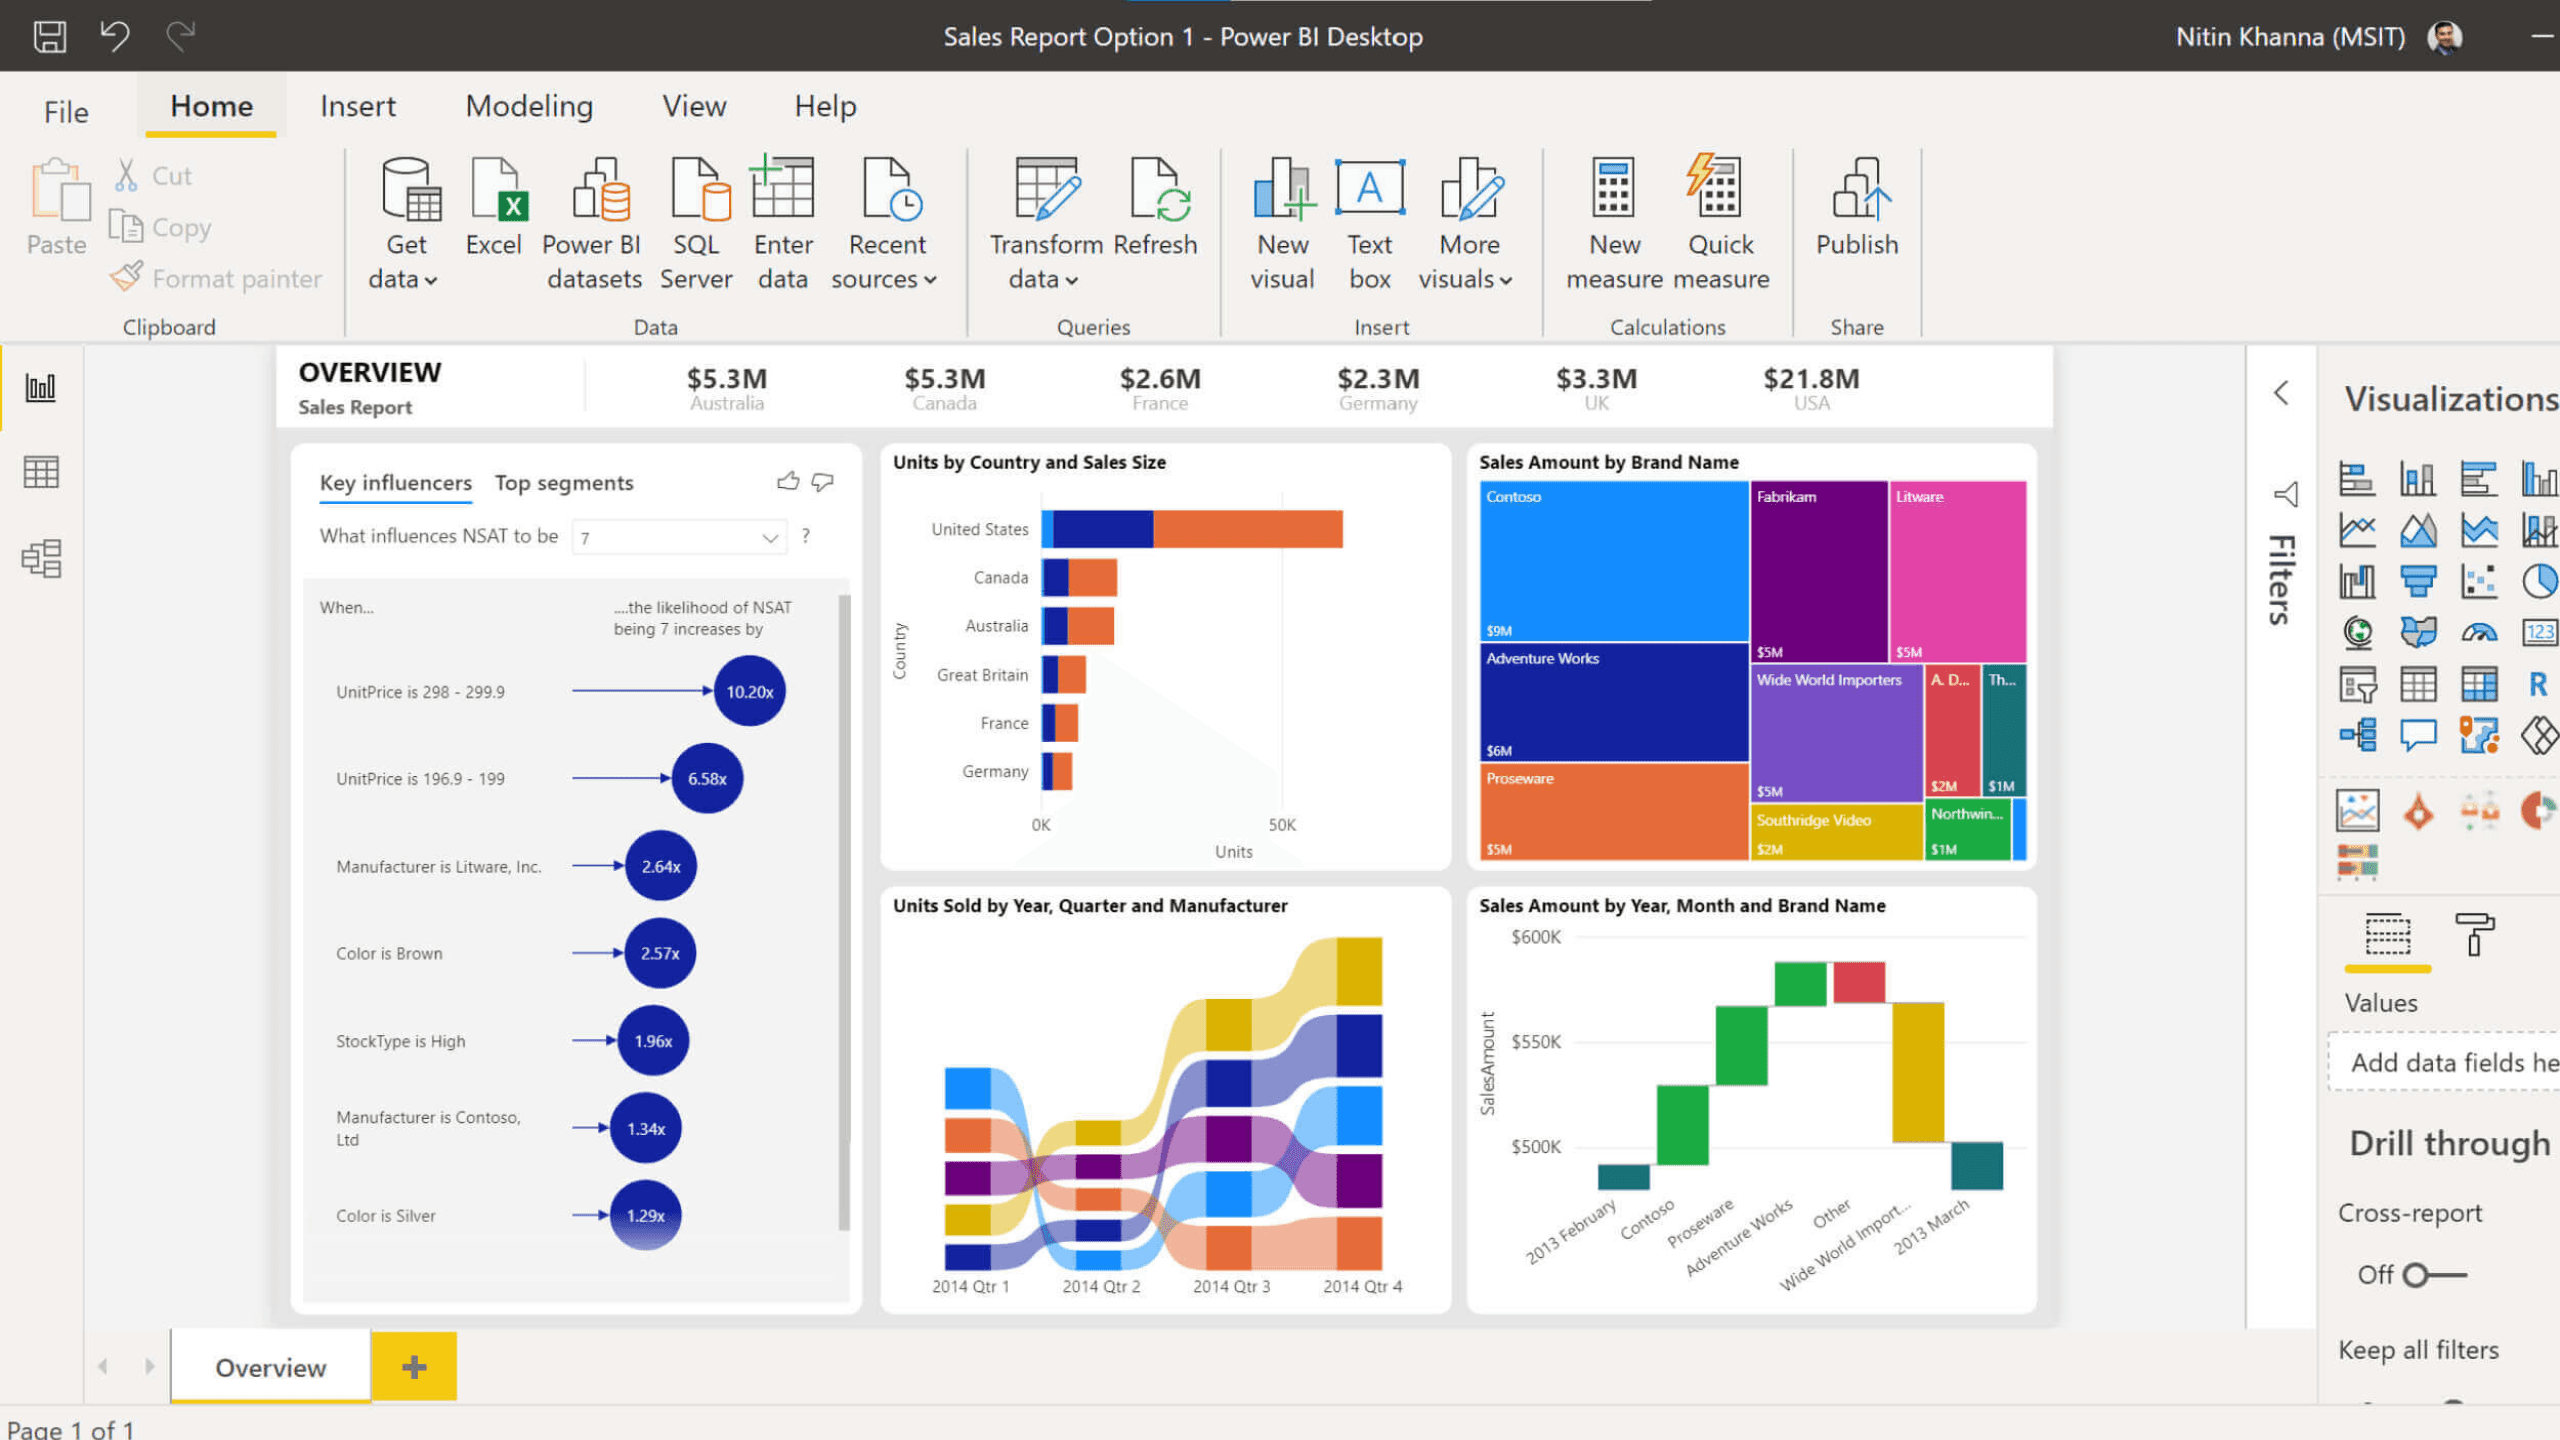
Power BI is a suite of business analytics tools that deliver insights throughout your organization. With Power BI, you can easily connect to data from various sources, create visually appealing and interactive reports, and share them with your team or clients.
So, why should your company consider using Power BI? Here are a few key benefits:
Improved decision-making: Power BI enables you to quickly and easily analyze data from various sources, giving you a clear and comprehensive view of your business. This allows you to make more informed and data-driven decisions.
Increased efficiency: Power BI streamlines the process of gathering, analyzing, and sharing data, saving you time and resources.
Enhanced collaboration: Power BI’s interactive reports and dashboards allow your team to collaborate and share insights in real-time, improving communication and collaboration.
Greater insights: Power BI’s sophisticated visualization and analysis capabilities allow you to uncover trends and patterns in your data that may not be immediately apparent.
Now that you know why Power BI is worth considering, let’s talk about how to use it. Power BI has a user-friendly interface and a wide range of resources to help you get started, including tutorials, webinars, and a comprehensive documentation center. Here are the steps to get started with Power BI:
Connect to your data: Power BI allows you to connect to various data sources, including Excel spreadsheets, databases, and cloud services.
Explore and transform your data: Use Power BI’s visualization and data transformation tools to explore and clean your data.
Create reports: Use Power BI’s report editor to create interactive and visually appealing reports.
Share your insights: Share your reports with your team or clients through the Power BI service or embed them in your company’s website or app.
In conclusion, Power BI is a powerful and essential tool for any business looking to leverage data to drive better decision-making, increase efficiency, enhance collaboration, and uncover valuable insights. If these seem like the solutions to your needs, give Power BI a try!
What is Looker Studio?
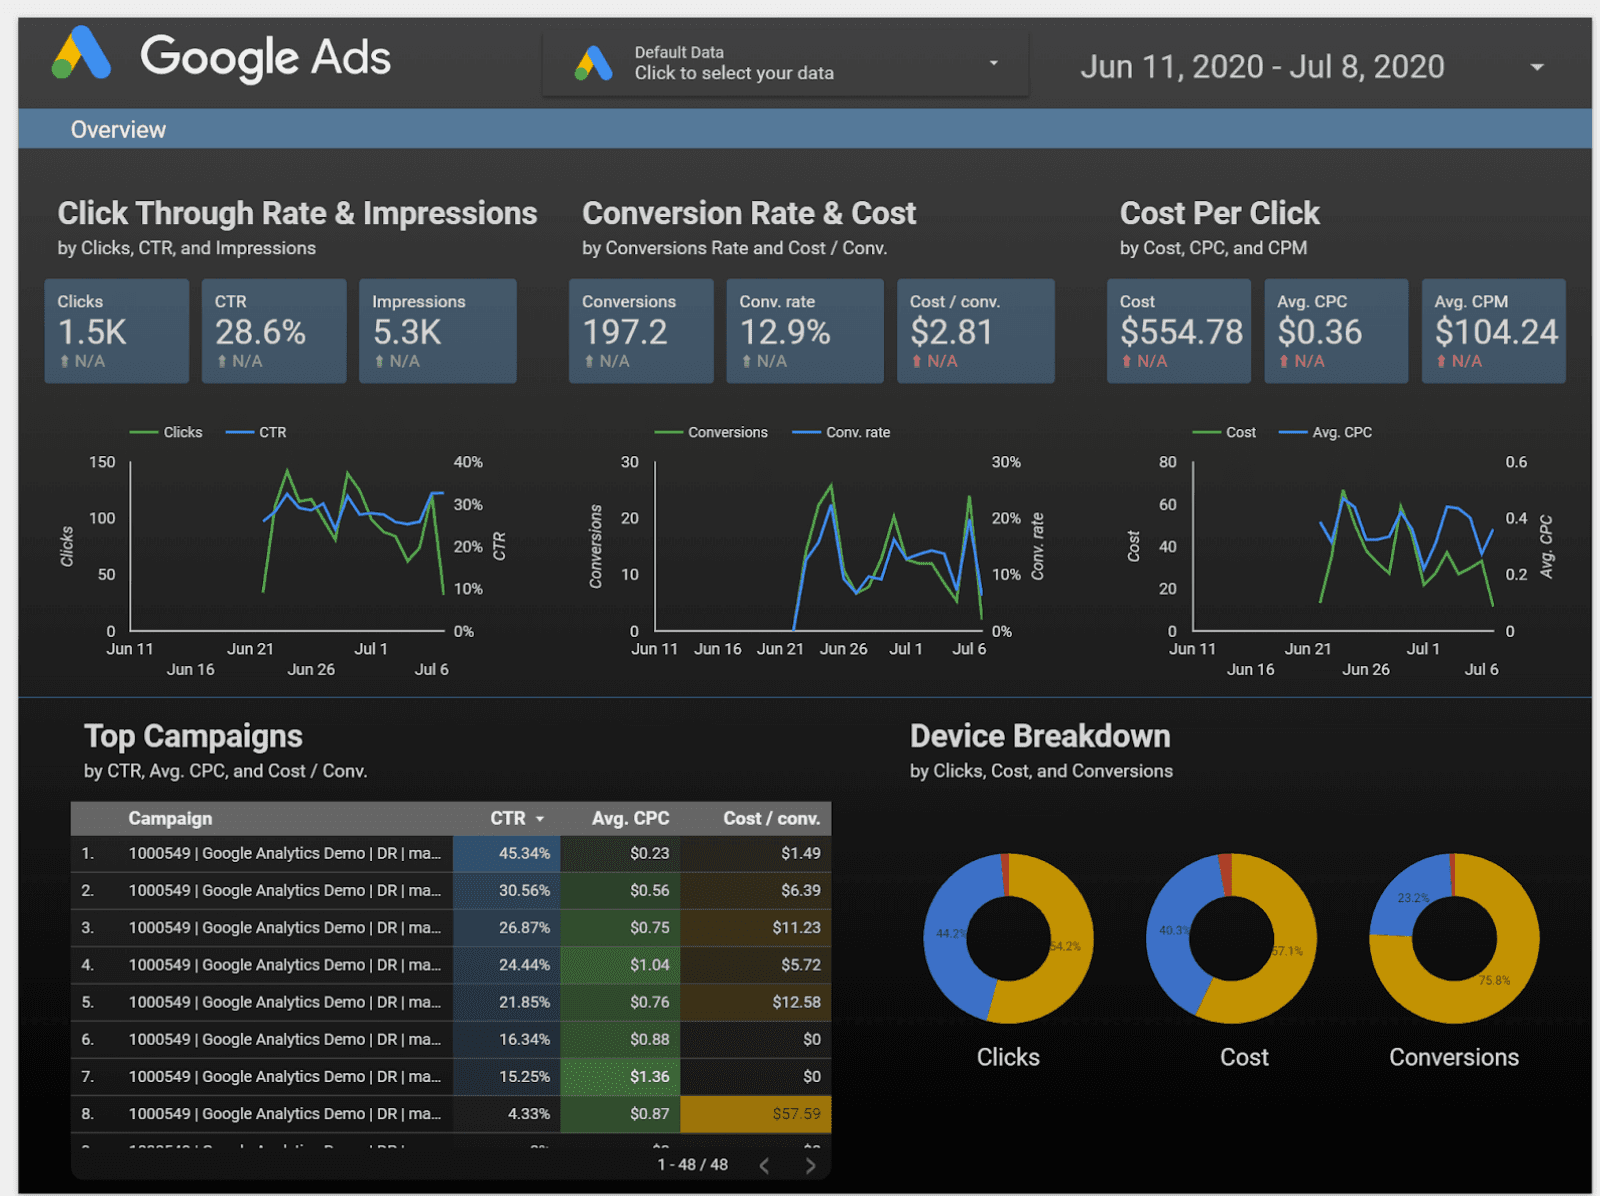
Looker Studio is a powerful data visualization and reporting tool that allows businesses to turn their raw data into customizable, professional-looking reports and dashboards. With Looker Studio, companies can easily access and analyze their data from various sources, including Google Analytics, Google Ads, and more.
1.Fast Report Building: One of the main benefits of using Looker Studio is that it allows businesses to save time and effort by automating the reporting process. Instead of manually pulling data from multiple sources and creating static reports, Looker Studio allows businesses to create interactive, real-time reports that can be accessed and updated from any device. This not only saves time but also ensures that the reports are always accurate and up-to-date.
2.Customization Options: Another advantage of Looker Studio is that it offers a wide range of customization options, allowing businesses to tailor their reports and dashboards to their specific needs. With the ability to choose from various visualizations, including graphs, charts, and maps, companies can create visually appealing and easy-to-understand reports. Looker Studio also allows businesses to share their reports with stakeholders, ensuring everyone has access to the latest data and insights.
3.Free of Charge: The biggest reason to use Looker Studio is that it is completely free to use. With no upfront costs or ongoing fees, businesses of all sizes can take advantage of this powerful tool to better understand their data and make informed decisions.
So how can businesses get started with Looker Studio? The first step is to sign up for a Google Account and connect your data sources. From there, you can create a new report and choose from various templates and visualizations to build your dashboard. As you become more familiar with the tool, you can experiment with customization options and connect additional data sources to enhance your reports.
In conclusion, Looker Studio is a valuable tool for businesses of all sizes looking to streamline their reporting process and better understand their data. With its wide range of customization options and the ability to connect to multiple data sources, Looker Studio allows businesses to create professional, interactive reports to help drive better decision-making. And with its free price tag, there is no reason not to try it.
No-Code BI Tools Can Provide Internal and External Value
How can businesses utilize these benefits?
As solid as they seem, businesspeople can use these top three technologies to improve their internal and external operations in a number of ways.
Internal Value
For instance, no-code BI tools allow them to create dashboards that display essential metrics such as revenue, profitability, and customer satisfaction, enabling them to identify trends and patterns in their data and make informed decisions about optimizing operations.
No-code BI tools allow businesspeople to create custom reports that showcase specific data points or metrics, helping them to clearly and concisely present data to stakeholders.
Their predictive analytics capabilities allow users to forecast future trends and make informed decisions about their business. This can be particularly useful for businesspeople looking to optimize operations and increase profitability.
No-Code BI Tools Can Provide External Benefits
The internal benefits are valuable, and what about the external benefits?
In addition to their internal applications, these no-code BI dashboard builders can also be utilized to enhance external operations. Tableau, Power BI, and Looker Studio all offer the ability to create public-facing dashboards that can be shared with customers and clients. This can be a valuable tool for companies looking to showcase their data and demonstrate their expertise in a particular field.
The use of no-code BI dashboard builders can have a significant impact on a company’s bottom line, helping them to streamline operations and make data-driven decisions that boost efficiency and profitability.
No-code BI tools can be used interchangeably depending on your exact project requirements. However, in some cases, you might have to stick to one. For example, Power BI does not have native macOS support. Therefore, if your organization widely adopted MacBook use, Power BI may not be your best option. We will cover these differentiating factors in a different blog post.
BI Tools vs. Custom Dashboards
When it comes to dashboard development solutions, companies can choose between no-code and custom-coded dashboards. Even though custom-built dashboards offer more customization options, there are many reasons why it is more rational to choose a no-code BI dashboard for your business.
Ease-of-Use and Ease-of-Maintenance
First and foremost, no-code BI dashboard technologies are generally easier to use and more accessible to a broader range of users. These tools often have intuitive interfaces, and drag-and-drop functionality, meaning people with little or no coding experience can use them. This can be particularly beneficial for companies that do not have a dedicated team of developers or want to make it easy for their entire organization to access and use dashboards.
Cost Effectiveness
Companies may choose no-code BI dashboard technologies because they can be more cost-effective than coded dashboards. Developing custom-coded dashboards can be time-consuming and resource-intensive, which can drive up costs. In contrast, no-code BI dashboard technologies often have pre-built templates and integrations with a wide range of data sources, which means that users can create dashboards more quickly and at a lower cost.
Adequate Level of Adaptability
No-code BI dashboard technologies can still offer flexibility and adaptability. These tools often offer a range of customization options and integrations with other systems and platforms. Users can easily modify and update their dashboards as their needs change. This can be particularly useful for companies that are looking to scale their operations or that want to be able to respond quickly to changing business conditions.
Final Notes
In summary, this blog post has delved into the world of no-code BI technologies and how they can benefit businesses of all sizes. We examined three popular no-code BI platforms’ key features and capabilities and explored the differences between no-code and custom-coded solutions.
By weighing the factors of adaptability, flexibility, cost structure, and customization, we aimed to help you determine which solution best suits your business needs. We also highlighted the numerous ways in which these technologies can streamline internal processes and drive external profits.
We hope this post has provided valuable insights and guidance on how no-code BI technologies can help your business thrive in the digital age. If you’re interested in learning more about how these tools can benefit your organization, please don’t hesitate to contact us. Our team of experts is ready to assist you and help you make the most of these powerful tools.
If you like this article, you can check out our other articles.


