
Ömer Faruk İlhan
5 Min Read
Learn how to use dashboards for effective KPI management and drive better business performance through data visualization.

Introduction
KPI management involves strategically setting, measuring, tracking, and analyzing Key Performance Indicators (KPIs) crucial to an organization's decision-making and goal achievement. These indicators help assess whether technology assets, such as IT systems, are functioning effectively. Failing to meet KPIs can have adverse effects on both the business and its customers, underscoring the importance of aligning and meeting these performance benchmarks for overall success. In today's article, you will find some crucial information about the critical role KPIs play and how KPI management is done with dashboards.
Contents
About KPI
Determining the KPI
KPI Dashboards
The Benefits of KPI Dashboards
Conclusion
Let’s dive in!
About KPI
Key performance indicators, or KPIs, are critical data points that allow you to measure progress toward your desired outcome or destination. With KPIs, you track and evaluate your performance along the path toward your goal. The purpose of key performance indicators is to assist in defining a company's strategic, operational, and financial successes, especially when compared to other companies in the same industry. For example, if the average net profit margin for companies in a sector is 50%, a new company entering that field should aim to at least achieve this margin to maintain competitiveness. KPIs provide a focal point for strategic and operational improvements, offering an analytical basis for decision-making. This knowledge helps you understand where to focus and identifies areas for improvement. They prompt many organizations to transition from reactive goal-setting to a proactive and effective approach.
KPIs can be qualitative or quantitative, measuring various aspects of performance such as financial, operational, or customer satisfaction. Examples of commonly used KPIs in the business world include sales growth, customer retention rates, and employee productivity. The determination of KPIs depends on the business's objectives and goals.
Determining the KPI
The process of preparing KPIs is a professional undertaking that should be managed by individuals with previous experience in using KPIs. Regardless of how KPIs are determined, they should serve a purpose and be equally relevant to all samples they address. Setting excessively challenging targets may lower individuals' performance, while easily achievable goals can lead employees to underestimate their work. Therefore, determining KPIs is a highly significant and specialized activity.
The performance values set for KPI targets also need examination. The measurability of these targets, their relevance to the main goal, and the gap between the established outcome will indicate whether the KPIs have been appropriately chosen. Since each department has its unique characteristics, KPIs from different areas possess varying features. General KPI values should be more inclusive compared to specific KPI values. When conducting calculations, general KPIs might attain higher numerical values relative to specific attributes.
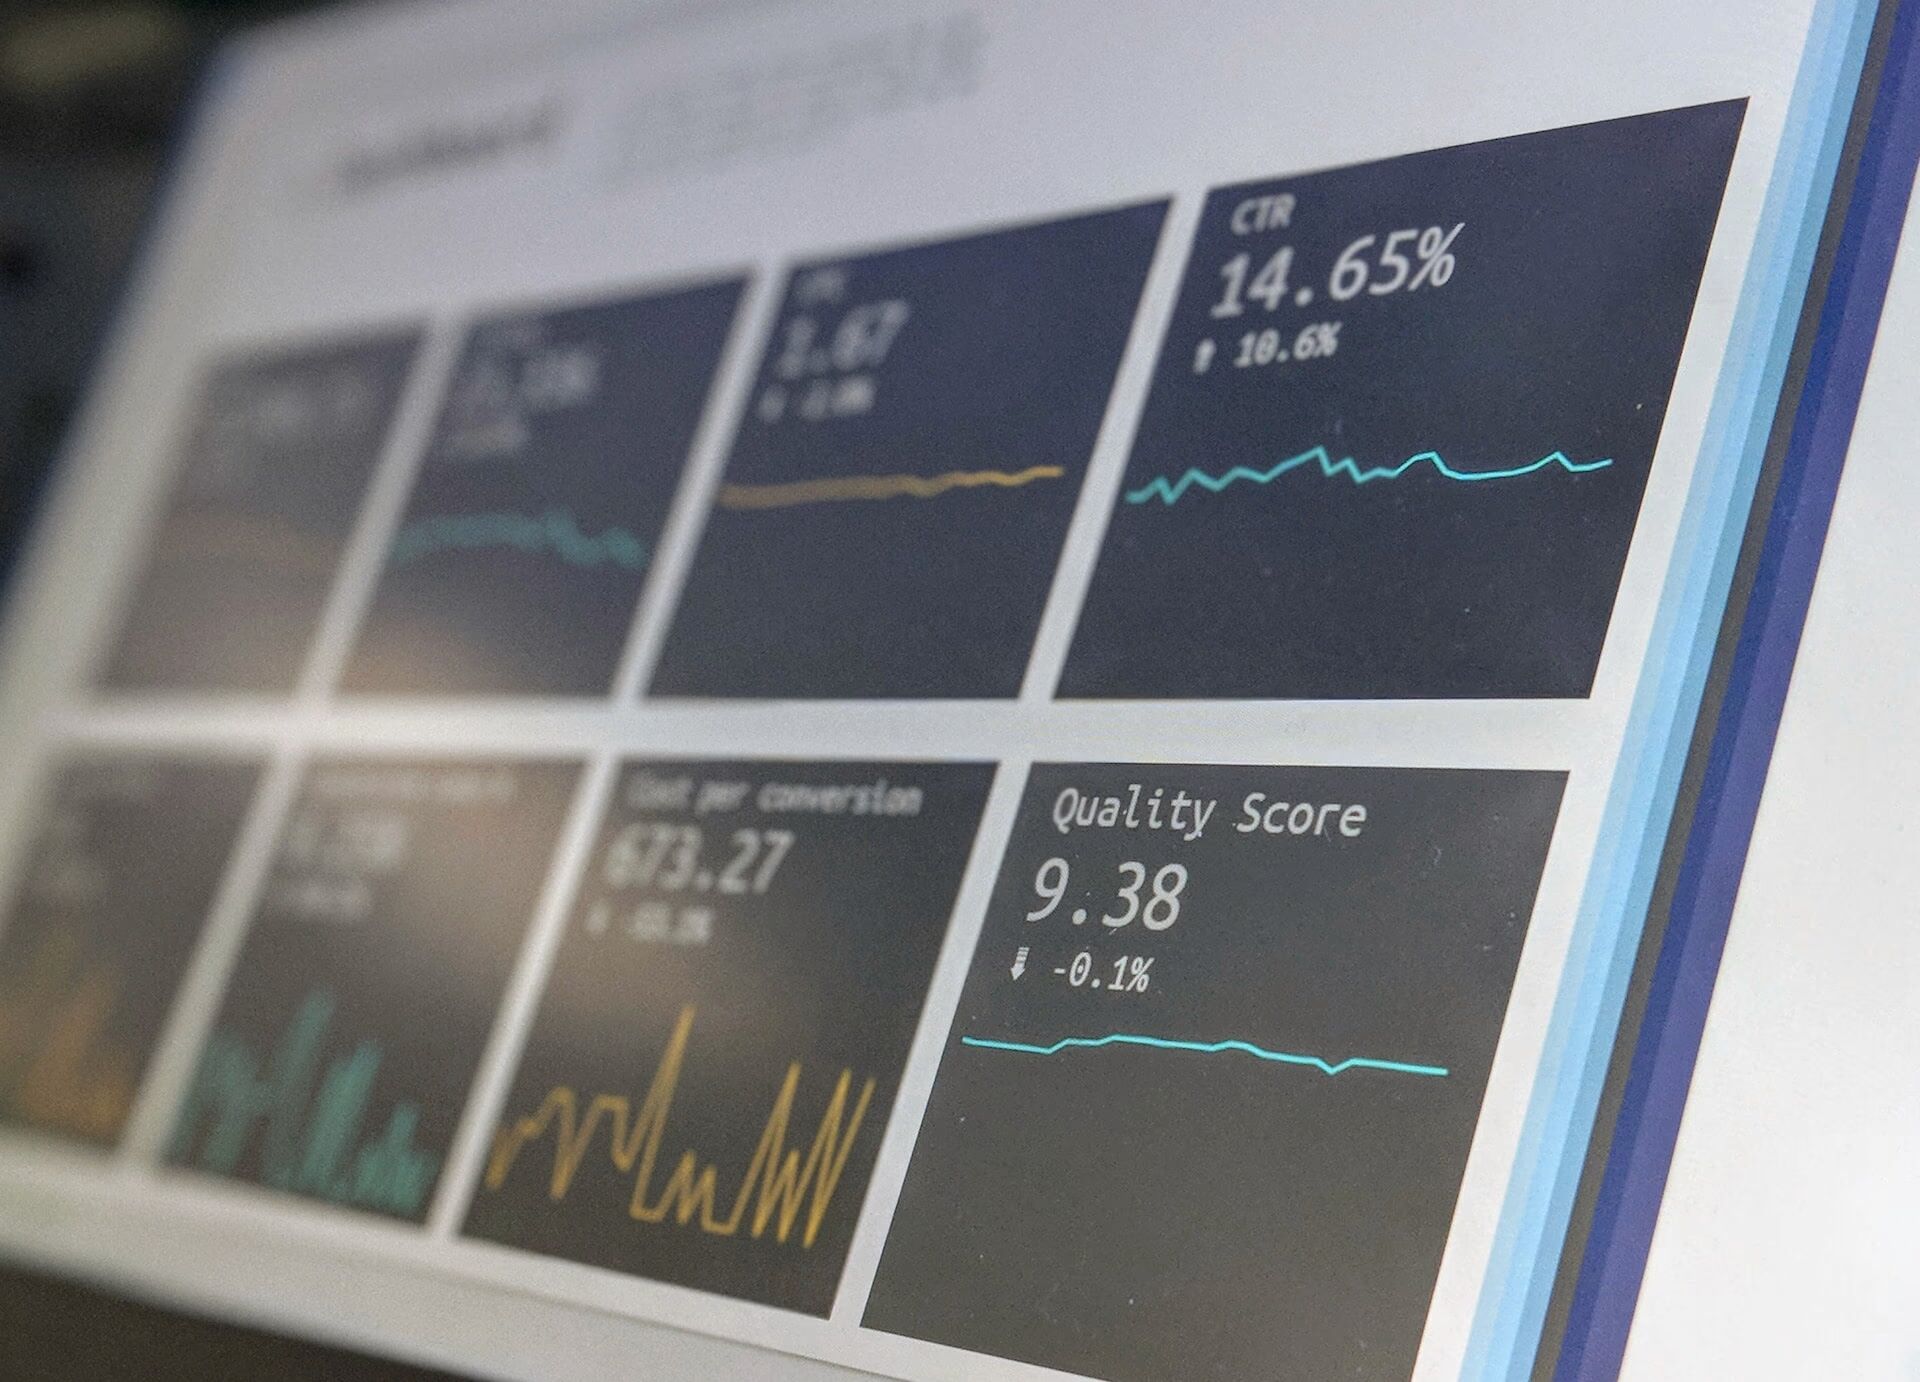
KPI Dashboards
Dashboards are visual tools that gather data from various sources and present it in an easy-to-understand format, highlighting the important story behind the data. They use graphs and charts to spotlight the main patterns and trends in the data, giving a quick overview of how a business is doing. Businesses track Key Performance Indicators (KPIs) to measure how well their strategies and goals are working. KPI dashboards focus on these important metrics, like cost-per-acquisition for maximizing ROI in marketing or employee retention rates for reducing turnover. These dashboards show these key indicators visually, making it easy to assess different aspects of a business's success and spot trends. Using charts and graphs, these dashboards help organizations keep track of their past and present performance in a simple, visual way. They can even predict future performance based on trends found in the data.
The Benefits of KPI Dashboards

KPI dashboards offer several ways to enhance business operations, improve efficiency, refining strategies, and fostering better interdepartmental communication to prevent isolated working structures. Here are six specific ways these dashboards can bolster businesses:
Strategy Assessment in Real Time
Effective KPIs selected by an organization gauge progress toward specific goals. Dashboards instantly assess the effectiveness of a strategy, aiding swift decision-making based on real-time data. Decision-makers can promptly adjust or redirect resources based on the strategy’s impact on KPIs.
Emphasizing Crucial Metrics
Among vast data volumes, KPI dashboards spotlight key performance indicators, visually presenting essential metrics crucial to business success. Visualizations offer immediate insight, allowing quick understanding without delving into raw data
Democratizing Data Insights
KPI dashboards simplify complex data, making insights accessible to all without requiring specialized analytical skills. This enables diverse roles within an organization to interpret and act on data-driven insights promptly.
Aggregating Diverse Data Sources
Dashboards effectively gather and interpret data from multiple sources, offering comprehensive and accurate insights crucial to understanding overall performance.
Seamless Information Sharing
Dashboards present snapshot overviews that are easily comprehensible to diverse audiences. Their accessibility across devices facilitates seamless information sharing within organizations, promoting collaboration and preventing isolated work processes.
Enabling Data-Driven Decisions
These dashboards eliminate subjective decision-making by providing objective data-based insights. Business leaders can confidently make decisions backed by factual data, maximizing the company's potential for success.
Conclusion
In conclusion, effective KPI management, achieved through the use of dashboards, stands as a pivotal strategy for modern organizations. Key Performance Indicators, or KPIs, serve as vital benchmarks that gauge progress toward organizational goals and overall success. These metrics offer a framework for assessing strategic, operational, and financial achievements, allowing comparisons against industry standards. The process of determining KPIs demands expertise and precision, ensuring that these indicators remain relevant, purposeful, and equally impactful across different business segments. KPI dashboards, as powerful visual tools, distill complex data into accessible, easy-to-understand formats, spotlighting essential metrics critical to business success. Moreover, these dashboards democratize data insights, enabling informed decision-making across diverse organizational levels. Their ability to aggregate multifaceted data sources, facilitate seamless information sharing, and drive data-backed decisions positions KPI dashboards as indispensable assets for organizations aiming to optimize performance and drive success in the dynamic business landscape. For expertly crafted dashboards that revolutionize your business insights, explore VIZIO.AI's cutting-edge solutions today and visualize your success in real-time!
If you like this article, you can check out our other articles.


