Bera Çobanoğlu
5 Min Read
Start your journey in data analytics with these 5 foundational concepts every beginner needs to know to thrive in 2024.
Introduction
Data analytics involves finding important patterns in data and sharing them. It uses statistics, computer skills, and research methods to understand how well something is doing. Visualizing data helps make these findings easier to understand. Businesses often use analytics to study their data and make predictions to improve how they work. It includes things like predicting trends and managing decisions. Because it deals with a lot of data, it needs powerful computers and the latest software. In other words, analytics turns data into helpful information for making better choices. Data Analytics aims to find useful insights that lead to smarter decisions and better results in business. Setting up a good system to store and analyze data, like a data warehouse or Business Intelligence (BI) setup, is crucial. It needs to be flexible and efficient for handling big and varied sets of data. As such, it is of great importance to learn this area in depth, which is critical for all companies. In today’s article, we are going to focus on the essential concepts in data analytics that every beginner should have an opinion on.
Contents
Data Analytics 101
Descriptive Analytics
Diagnostics Analytics
Predictive Analytics
Prescriptive Analytics
Exploratory Analytics
Let’s dive in!
Data Analytics 101
First of all, it is important to answer the question of what data analytics is before understanding these concepts. In today's digital age, a massive amount of data is being created, bringing about new possibilities. With substantial computing capabilities and vast data reserves, we can leverage this information for making decisions based on data analysis. The key advantage of these data-influenced decisions lies in their foundation on past successful trends. In brief, data analytics involves working with data to uncover valuable trends and concealed patterns, providing valuable insights for predicting business outcomes. In this context, there are a few important concepts you need to grasp data analytics as we mentioned before. Let's examine these concepts together.
Descriptive Analytics
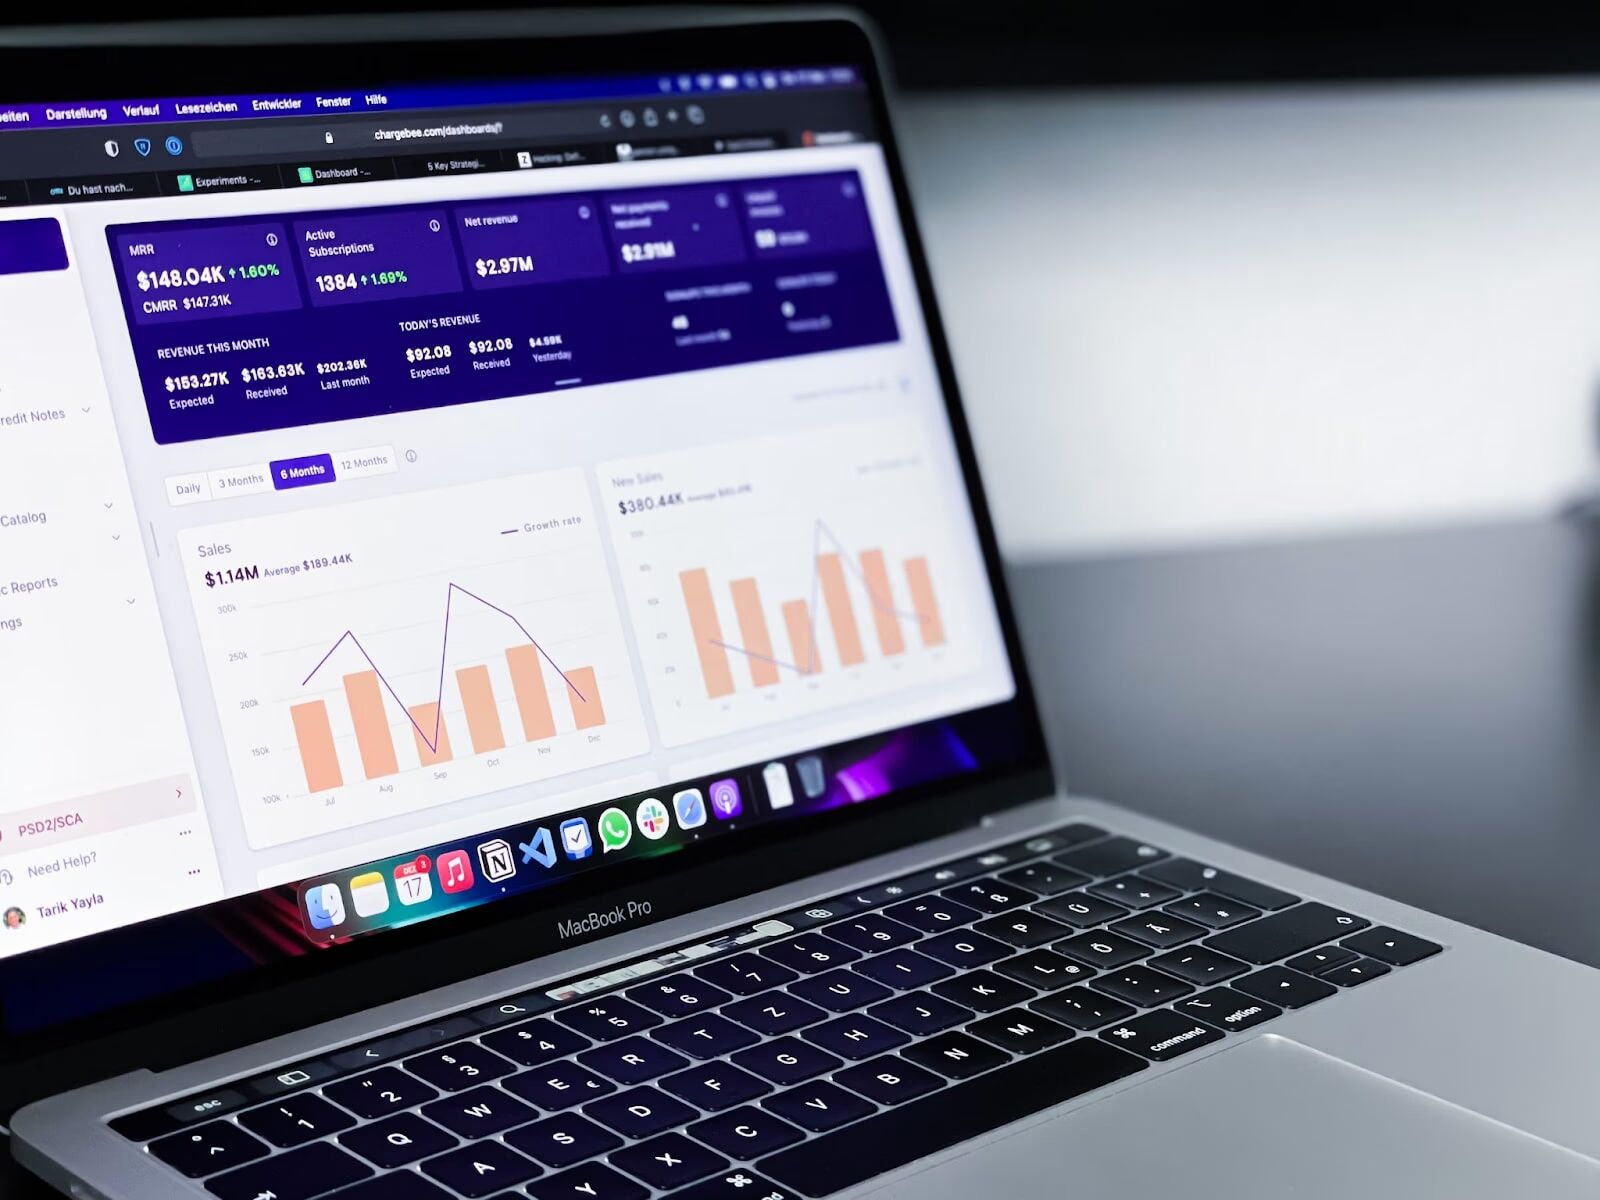
The first data analytics concept we are going to examine is Descriptive Analytics. One of the most important concepts of data analytics 101. Mainly focuses on summarizing what occurred in an organization. It looks at raw data to answer questions like "What happened?" and "What's happening now?" This kind of analytics uses traditional business tools like bar charts, pie charts, and graphs to show information. For instance, in a bank, it might use past financial data to predict how a customer might perform financially. It's also handy for understanding sales patterns, like sorting customers based on what they prefer. Typical instances of Descriptive Analytics include historical reviews found in company reports, such as data queries, reports, descriptive statistics, and data dashboards.
Diagnostics Analytics
Diagnostic analytics is all about finding out the reasons behind something that happened. For instance, if you're running a social media marketing campaign, you might want to know why you got a certain number of likes, reviews, mentions, followers, or fans. Diagnostic analytics helps by condensing lots of mentions into one view so you can improve your campaign.
Predictive Analytics
Predictive analytics involves using data, machine learning, and statistical techniques to estimate what might happen in the future based on past information. Its main aim is to move beyond understanding past events and offer the most accurate predictions about what's likely to occur next. By analyzing past outcomes, predictive models make predictions for various types of data, even new ones. These models are crucial as they estimate the probability of a specific result—like revenue—based on a set of input factors. Common models in predictive analytics include classification and regression. In banking, predictive analytics is handy for spotting fraud, evaluating credit risks, and identifying opportunities to increase sales. This helps in keeping valuable customers and growing the business. We can say it is a crucial element of data analytics 101.
Prescriptive Analytics
Prescriptive analytics is like a guidebook for making decisions in data analytics concepts. It not only tells you what actions to take but also considers the best possible outcomes within certain boundaries or conditions. Imagine it as a roadmap that uses rules and optimization techniques to help you reach your destination efficiently. By using tools such as graphs and simulations, it assists in making choices and plans. Understanding the various types of analytics is crucial for becoming data-savvy, particularly as they merge with the capabilities of artificial intelligence, creating new opportunities for informed decision-making.
Exploratory Analytics
Exploratory analytics is all about finding general patterns and unexpected elements in raw data. It's essential for understanding outliers and unanticipated features that might not show up in other types of analysis. To use this method, you need to recognize where these unusual occurrences happen and how they connect to other factors, aiding in making informed choices For instance, in monitoring biological data, multiple stressors can affect various sites. Understanding the connections between these stressors and biological responses is crucial. Visual tools like scatterplots and correlation coefficients offer valuable insights into these relationships However, when examining multiple variables, it's essential to use more advanced multivariate visualization techniques to gain deeper insights.
In conclusion, the realm of data analytics is vast and constantly evolving, offering exciting opportunities for businesses to harness data for informed decision-making. The concepts we've explored are just the tip of the iceberg. If you're looking to delve deeper into data analytics or wish to transform your business's approach to data, VIZIO.AI is your go-to partner. With our expertise in BI Dashboard Development, Custom Enterprise Software Development, and our cutting-edge Sirius platform, we offer tailored solutions that turn complex data into actionable insights. Don't let your data's potential go untapped. Connect with VIZIO.AI today to explore how our services can elevate your data analytics strategy and drive your business forward.
If you like this article, you can check out our other articles.


