Mustafa Kürşat Yalçın
8 Min Read
Wondering How Data Visualization Can Impact Your Business? In 2024, clear data insights are key to staying competitive. Let’s explore the trends and benefits that can drive your success!
Introduction
Picture this: You’re in a meeting, and instead of sifting through endless spreadsheets and numbers, you’re presented with clear, colorful charts that instantly make sense of the data. Sounds refreshing, right? That’s the power of data visualization, and it’s changing the way businesses operate in 2024. As data continues to drive decision-making, the ability to visualize it effectively is becoming more than just a nice-to-have — it’s a must.
So, why is data visualization gaining such momentum this year, and how can your business benefit from it?
Let’s dive in and explore the transformative impact of data visualization on modern business strategies.
Data Visualization: The New Language of Business
In 2024, data is more than just numbers — it’s a story waiting to be told. But not everyone speaks the language of data fluently, and that’s where data visualization comes into play. It’s not just about making data look pretty; it’s about making it understandable and actionable.
1. Simplifying Complex Information:
Data can be overwhelming, especially when presented in dense, text-heavy reports. Data visualization simplifies this information, distilling complex data sets into visuals that are easy to interpret. Imagine trying to understand customer demographics through pages of raw data—now picture the same information displayed in a pie chart or heatmap. The latter not only saves time but also highlights key trends and outliers immediately. This simplification is crucial in fast-paced business environments where decisions need to be made quickly and based on clear, concise information.
2. Enhancing Communication Across Teams:
One of the most significant benefits of data visualization is its ability to bridge communication gaps within an organization. Different departments often struggle to align because they view and interpret data differently. Visualizations provide a universal language that can be understood by everyone — from data scientists to marketing executives. For instance, a sales team might use a bar chart to demonstrate quarterly performance trends, which can then be easily interpreted by the finance department to adjust budgeting strategies. This cross-functional clarity ensures that everyone is on the same page, leading to more cohesive and informed decision-making.
3. Facilitating Data-Driven Decision Making:
Data-driven decision-making is only effective when the data is understood by all stakeholders. Visualization tools empower decision-makers to grasp insights quickly, allowing them to act swiftly and confidently. For example, a CEO reviewing a dashboard of key performance indicators (KPIs) can instantly see where the company is excelling or underperforming without needing to dive into the granular details of the underlying data. This ability to see the big picture at a glance enables faster, more strategic decisions that can drive the business forward.
The Rise of Interactive Data Visualization in 2024
Static charts and graphs are no longer enough in 2024. Businesses are now turning to interactive data visualizations that allow users to explore data from multiple angles, drill down into details, and even predict future trends. This shift is not just about aesthetics — it’s about enhancing the depth and utility of data analysis.
1. Interactive Dashboards:
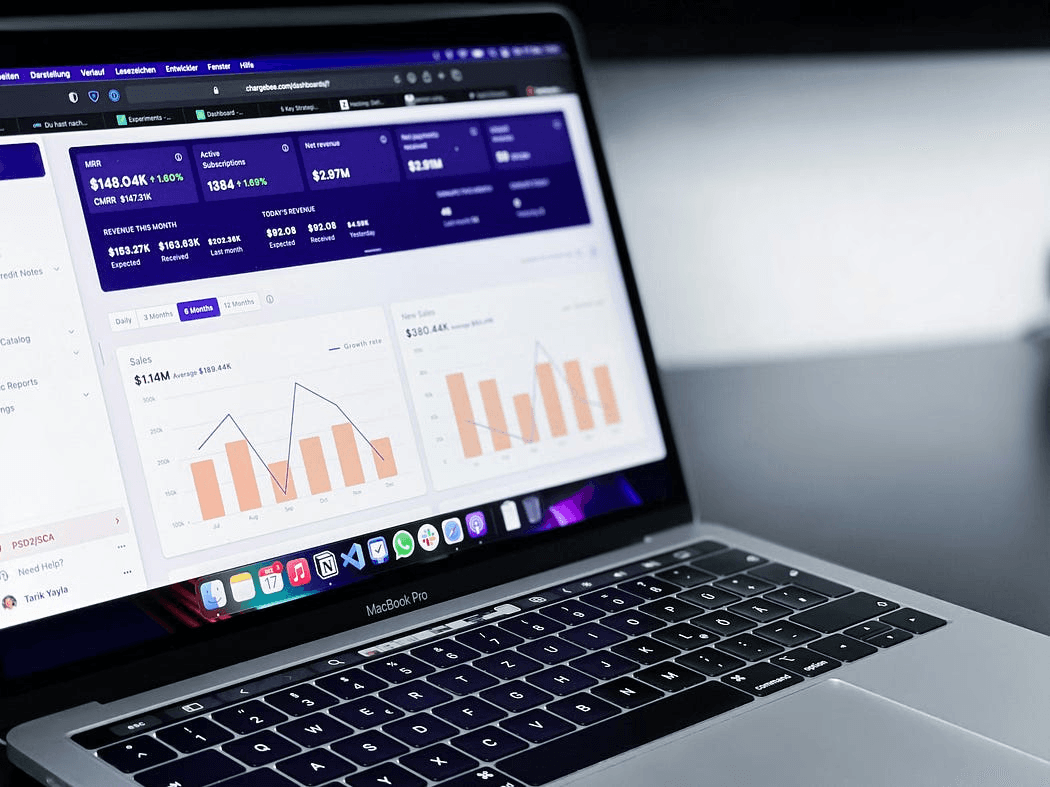
Interactive dashboards have become a staple in modern business intelligence tools. Unlike static reports, these dashboards allow users to interact with data in real time. For instance, a manager could use a dashboard to filter sales data by region, product, or time period, instantly generating new insights based on the specific criteria selected. This level of interactivity empowers users to explore data on their own terms, making it easier to identify trends, correlations, and opportunities for improvement.
2. Predictive Analytics with Visualizations:
Businesses are turning to predictive analytics to forecast future trends. Data visualization makes predictive models easier to understand. For example, a retail business might use a visualization tool to predict customer demand for the upcoming quarter and make proactive adjustments to their strategies.
3. Customization and Personalization:
In 2024, there is a growing demand for customized data visualizations in businesses. Different teams need tailored visualizations based on their specific needs, such as finance focusing on cost analysis and marketing emphasizing customer engagement. Modern data visualization tools allow for this level of customization, enhancing user engagement and driving more effective decision-making.
How Data Visualization Improves Customer Understanding
Understanding your customers is key to any successful business strategy. In 2024, data visualization tools are helping businesses achieve this by turning customer data into vivid, easy-to-understand visuals that reveal patterns and insights that might otherwise be missed.
1. Visualizing Customer Journeys:
Customer journey mapping is a critical aspect of understanding how customers interact with your brand. Data visualization takes this a step further by mapping these journeys in a visual format that clearly shows the steps customers take, the touchpoints they interact with, and where they drop off. For instance, a heatmap can reveal which parts of a website are getting the most attention and which are being ignored. This insight allows businesses to optimize user experiences, improve conversion rates, and ultimately enhance customer satisfaction.
2. Segmenting Audiences with Clarity:
Audience segmentation is another area where data visualization proves invaluable. By visualizing demographic data, purchasing behavior, and other customer attributes, businesses can easily segment their audience into distinct groups. For example, a company might use cluster analysis to visualize customer segments based on purchase history, identifying high-value customers who are likely to be brand loyalists. This visual segmentation enables more targeted marketing strategies, ensuring that each customer receives messaging and offers that resonate with their specific needs and preferences.
3. Personalizing Marketing Efforts:
Personalization is a major trend in marketing, and data visualization helps businesses take it to the next level. By visualizing data from customer interactions, companies can identify patterns that inform personalized marketing campaigns. For example, a retailer might use visual data to determine which products are most popular among specific customer segments, allowing them to tailor promotions and recommendations accordingly. This level of personalization not only improves customer engagement but also drives higher conversion rates and customer loyalty.
What to Expect in the Future: How Leading Brands Are Preparing for the Data Visualization Revolution
As data visualization continues to evolve, businesses must be ready to adapt and innovate. Leading brands are already taking steps to integrate advanced data visualization tools into their strategies, setting the stage for even greater benefits in the future.
1. Investing in Advanced Visualization Technologies:
Companies like Tableau, Microsoft, and Google are leading the charge in developing cutting-edge data visualization tools. These technologies are becoming more intuitive, allowing even non-technical users to create sophisticated visualizations. For example, Tableau’s latest features include AI-driven insights that automatically suggest the most relevant visualizations for the data at hand. Businesses investing in these technologies are positioning themselves to extract more value from their data, staying ahead of the competition in an increasingly data-driven world.
2. Focusing on Data Literacy Across the Organization:
It’s not enough to have the tools — employees need to know how to use them effectively. That’s why companies like General Electric (GE) and IBM are prioritizing data literacy training across their organizations. By ensuring that employees at all levels understand how to interpret and utilize data visualizations, these companies are empowering their workforce to make data-driven decisions. GE, for instance, has implemented company-wide training programs focused on data literacy, ensuring that everyone, from engineers to executives, can contribute to the company’s data-driven culture.
3. Emphasizing Real-Time Data and Collaboration:
Real-time data is becoming a standard expectation, and leading brands are leveraging data visualization tools to facilitate real-time collaboration. Platforms like Google Data Studio allow teams to work together on live dashboards, making it easier to share insights and make collective decisions quickly. This collaborative approach is particularly valuable in fast-moving industries where decisions need to be made on the fly. By emphasizing real-time data and collaboration, companies can ensure that their teams are always working with the most up-to-date information, leading to more agile and informed business practices.
Case Study: Microsoft’s Use of Data Visualization to Drive Business Success
Microsoft, a leader in data visualization, has been leveraging these tools to enhance its decision-making processes and drive business success. The company’s journey with data visualization provides a clear example of how visual tools can transform business operations.
Challenge:
Microsoft needed a way to make sense of the vast amounts of data generated across its global operations. Traditional methods of data analysis were time-consuming and often failed to provide the insights needed to make strategic decisions quickly.
Approach:
To address this challenge, Microsoft implemented Power BI, its own data visualization tool, across the organization. Power BI allowed teams to create interactive dashboards that could be customized to meet the needs of different departments. For instance, the marketing team used Power BI to visualize campaign performance, while the finance team used it to monitor budget allocations in real time.
Results:
The implementation of Power BI led to significant improvements in how Microsoft handled its data. Teams were able to identify trends and make decisions much faster, leading to a 25% increase in operational efficiency. Additionally, the tool helped reduce reporting time by 30%, allowing teams to focus more on strategy and less on data collection. The success of Power BI has solidified Microsoft’s position as a leader in the data visualization space, showcasing the powerful impact of visual tools on business performance.
Conclusion: Embracing Data Visualization in 2024 and Beyond
As we move through 2024, the importance of data visualization in business continues to grow. From simplifying complex information to enabling real-time decision-making, the benefits are clear. Businesses that invest in advanced data visualization tools and foster a data-literate culture will be best positioned to thrive in a data-driven future.
The journey doesn’t end here. As technologies evolve, so too will the ways we visualize and interact with data. The companies that embrace these changes will take charge in the future, turning data into their most valuable asset. Are you ready to see what data visualization can do for your business? The future is visual — don’t get left behind.


