Beyond BI: Turning Dashboards into Automated Decision-Making Tools
What if your dashboard didn’t just report insights but took immediate action without needing you? Yes, that is a thing!

Mustafa Kürşat Yalçın
6 Min Read

For any company aiming to become data-driven, traditional business intelligence (BI) tools are indispensable for basic visibility. Yet, these tools can struggle to meet today’s demands for real-time, actionable data.
Integrating AI and machine learning into BI platforms helps organizations bridge this gap, enabling dashboards to go from static information displays to autonomous, action-oriented systems. Automated decision-making dashboards promise not only faster insights but also reduced reporting times and more accurate, actionable tracking of KPIs.
In this blog, we’ll explore;
how BI is advancing from data visualization to action-oriented intelligence,
helping organizations reduce inefficiencies,
improve accuracy,
react quickly to shifting dynamics.
Shall we?

Moving Beyond BI: From Insights to Automated Action
In a typical BI setup, dashboards aggregate and display data insights, leaving it to users to interpret and decide on follow-up actions.
In industries with rapidly changing market conditions — like e-commerce and finance — this reliance on manual interpretation creates lags. Automated decision-making tools address this by autonomously analyzing data and triggering responses, allowing organizations to move at the speed of data.
Take retail as an example. A conventional dashboard might alert teams to a spike in demand or a low stock level, prompting them to place new orders manually. An automated decision-making dashboard, on the other hand, can detect these trends, predict future demand, and autonomously reorder inventory, reducing missed sales opportunities.
In fact, McKinsey reports that automated decision-making tools can reduce operational costs by up to 20%, streamlining actions based on insights that would otherwise be delayed by human intervention.

Core Technologies Behind Automated Decision-Making Dashboards
For a dashboard to support automated decision-making, several key technologies must come together seamlessly.
Here’s a breakdown of the core elements that make this possible:
Machine Learning Models: Machine learning (ML) enables dashboards to recognize patterns and predict outcomes. Using platforms like Google Cloud’s AutoML and Microsoft Azure Machine Learning, organizations can forecast demand, detect anomalies, and adjust operations without requiring in-depth technical expertise.
Real-Time Data Integration: Access to live data is crucial for automated responses. Platforms like AWS Kinesis and Azure Stream Analytics allow dashboards to monitor and process live data from diverse sources, ensuring timely action in sectors where rapid response is a necessity.
APIs for Workflow Automation: APIs enable seamless interaction between dashboards and other systems, allowing for workflow automation. For instance, Zapier and Integromat help initiate automated processes like alerting teams, updating databases, or even reallocating resources based on data trends, allowing real-time adjustments across departments.

Enhancing Core Functions with Automated Decision-Making
Automated decision-making dashboards are reshaping various business functions, driving agility and precision across departments:
Marketing: Real-Time Campaign Optimization
For marketing teams, real-time data enables more precise customer engagement. AI-powered dashboards analyze customer behavior and automatically adjust campaigns to maximize reach and relevance. Tools like Salesforce Einstein provide insights into which messages are resonating and adjust them dynamically, allowing teams to focus on big-picture strategy while the dashboard handles real-time optimizations.
Operations: Proactive Resource Management
In operations, predictive dashboards transform the way teams manage resources. For instance, IBM’s Maximo uses predictive maintenance analytics to identify early signs of equipment wear and schedule maintenance before issues arise, which prevents costly disruptions. This proactive management is particularly valuable in industries with high operational costs, where uninterrupted service is essential to meeting customer demands.
Finance: Streamlined Risk and Compliance Monitoring
In finance, automated dashboards improve efficiency and reduce risk by tracking expenses and flagging anomalies. Platforms like SAP Analytics Cloud allow finance teams to predict cash flow, monitor compliance in real-time, and alert to suspicious activity, helping to control costs and safeguard company assets.

Best Practices for Implementing Automated Dashboards
Implementing an automated decision-making dashboard effectively requires a structured approach. Here’s a guide to setting it up successfully:
Prioritize Data Quality and Integration: Data quality is fundamental to actionable insights. Centralizing data in platforms like Tableau or Snowflake ensures dashboards are fed accurate, consistent information that’s ready for automated processing.
Set Clear Automation Goals: Identifying the specific goals for automation, such as reducing reporting times or improving real-time KPI tracking, aligns the dashboard’s capabilities with organizational needs. Goals create a roadmap that informs system design and integration, maximizing the dashboard’s impact.
Start with Simple Automations and Scale Gradually: Automate low-stakes processes first, such as report generation or notifications, allowing teams to familiarize themselves with the system. Starting small reduces risk and builds confidence, creating a foundation for broader, high-impact automation.
Empower Your Team with Training: While dashboards can handle much of the decision-making, human oversight is essential for refining processes and interpreting insights. Training sessions on how to use and interpret dashboard data equip employees to leverage the system entirely.

Case Study: Netflix’s Data-Driven Personalization at Scale
With millions of global users, Netflix relies on data-driven personalization to enhance engagement. Traditional BI systems, however, struggled to scale with such a large user base, prompting the need for automation in content recommendations.
Challenge
Netflix needed a dynamic, automated system to analyze user behavior in real-time and make instant, personalized recommendations.
Solution
By implementing a machine-learning recommendation engine, Netflix automated the process of analyzing viewer patterns and suggesting content in real-time. The system not only detects emerging trends but adjusts recommendations to each user’s evolving tastes, enhancing engagement and satisfaction.
Impact
Automated recommendations now account for nearly 80% of Netflix’s views, driving both customer retention and satisfaction. This illustrates how predictive, data-driven decision-making can transform customer experience — a key insight for organizations aiming to enhance engagement through personalization.
Leveraging Advanced Tools to Boost Dashboard Capabilities
Organizations seeking to expand their BI capabilities should consider integrating specialized tools that add intelligence to their dashboards.
Here’s a look at some tools that elevate BI from data visualization to decision-making support:
Google Cloud’s AutoML: Designed for organizations without extensive data science resources, AutoML provides predictive insights for customer segmentation, demand forecasting, and trend analysis, empowering teams with advanced analytics.
Azure Stream Analytics: Built for real-time analysis, this platform is ideal for monitoring KPIs and quickly adjusting strategies based on current data, essential for finance and operations teams that require constant oversight.
Tableau’s AI-Powered Insights: Tableau’s predictive analytics and user-friendly design make it accessible for non-technical users, transforming insights into actionable recommendations that drive decision-making at every level.
Integrating these tools enables organizations to turn dashboards into intelligent systems that actively support decision-making, optimizing resource allocation and driving productivity.
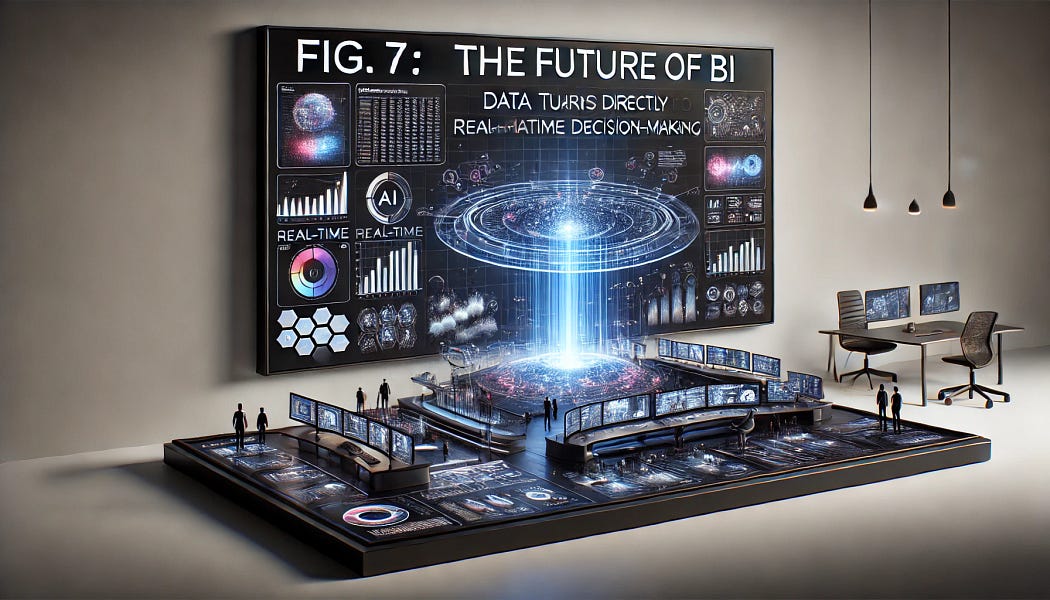
Conclusion: The Future of BI in Automated Decision-Making
As BI evolves, dashboards are moving beyond data visualization to automated, action-oriented intelligence. Automated decision-making tools bring value by reducing manual reporting cycles, enhancing KPI accuracy, and empowering teams to respond in real time. The shift from passive insights to active, real-time decision-making enables companies to anticipate better and act on market changes.
By adopting these advanced BI tools, organizations are now equipped to turn data into action, positioning themselves for more dynamic and data-driven growth.
The future of BI is here, transforming insights into immediate, impactful decisions.